Analysis of Iohexol using the Advion Interchim Scientific AVANT® HPLC and expression® CMS System

Introduction
Iohexol is a widely used non-ionic imaging agent that improves contrast for x–ray analysis. Its low osmolality allows for a rapid clearance via the kidney, preventing reabsorption and further metabolization[1]. This makes iohexol a compound with a better safety profile compared to other imaging agents[2].
In many clinical imaging applications, imaging agents/contrast agents are administered to patients to improve the contrast and spatial resolution of the scan. Due to toxicity and side effects of imaging agent, preparations of their known concentrations and their purity analysis are very important for their safe use and accurate diagnostic.
In this application note, a simple and accurate HPLC-CMS method for iohexol analysis is introduced.

Method
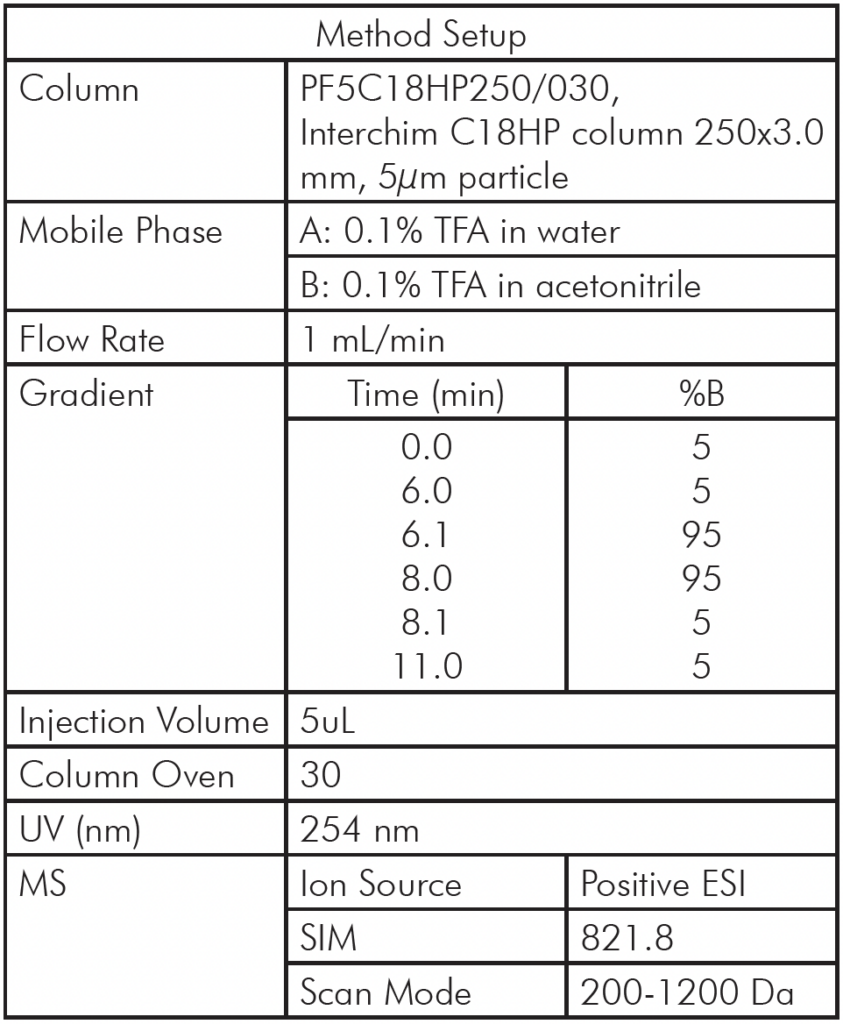
Method Setup
All solvents used in the application were HPLC grade.
Two Iohexol standards were obtained from Sigma Aldrich.
One was a certified reference material with purity of 99.99%, the second one had a stated purity of ≥ 95%.
All experiments were performed on an Advion Interchim Scientific® expression® Compact Mass Spectrometer coupled with an AVANT® UHPLC system with parameters as shown in Table 1.
Table 1: HPLC/MS Method
HPLC/UV/MS Analysis of Iohexol
At room temperature, iohexol will isomerize with two peaks detected in its HPLC/UV/MS analysis.
These two peaks (Figure 1A) come from hindered rotation of the anilide N-acetyl group due to the bulky iodine atoms attached to the central benzene ring of the iohexol. Those two compounds are essentially “rotational isomers” that interchange slowly at room temperature in aqueous solution.
Both peaks are confirmed with MS analysis to show the same m/z at 821.9 (Figure 1B and 1C) and no difference was visible in their in-source CID mass spectra (Figure 2A and 2B).
Since both rotamers contribute to the compounds toxicity and imaging enhancing capabilities in x-ray analysis, the sum of both peaks will be used for any further iohexol analysis in this application note.
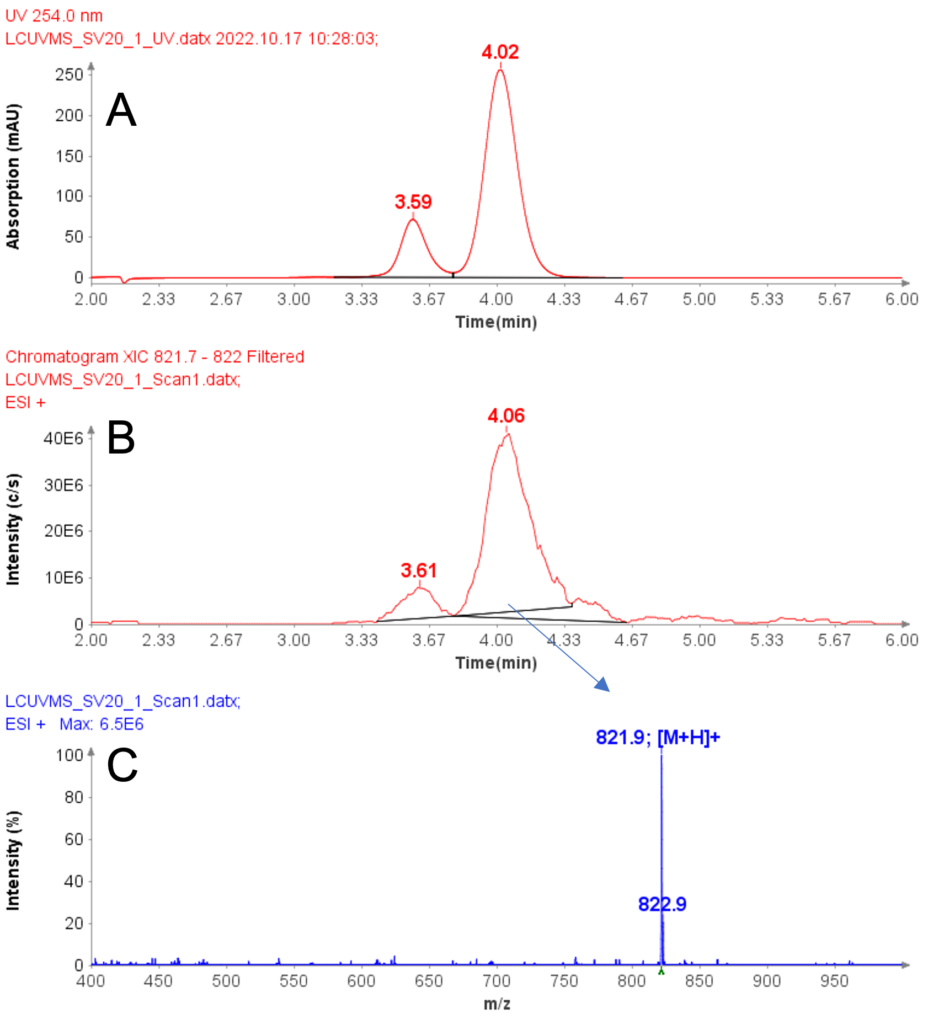
Figure 1: (A) HPLC chromatogram (254 nm) of iohexol, (B) The extraction ion chromatogram of protonated iohexol at m/z 821.8, (C) The averaged MS spectra from peak at RT 4.06 min.
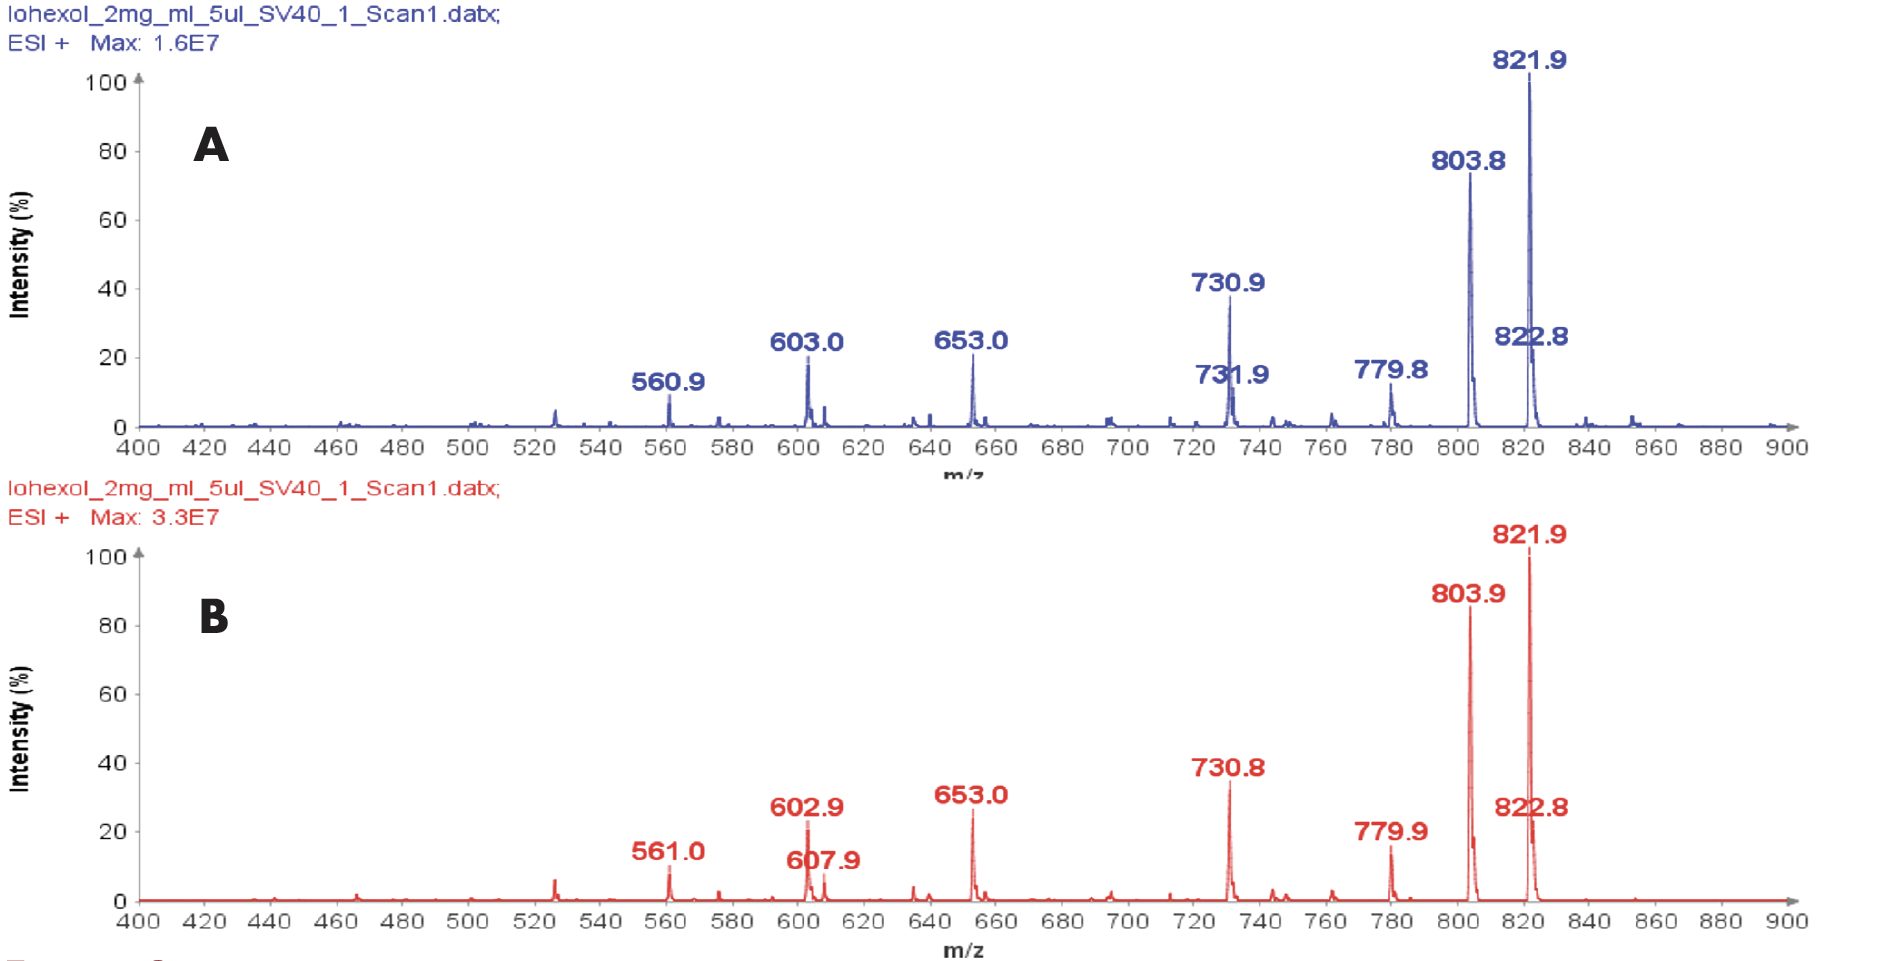
Figure 2: (A) The averaged in-source CID mass spectra from peak at RT 3.61 min, (B) The averaged in-source CID mass spectra from peak at RT 4.06 min.
Purity Determination by HPLC/UV Analysis
By comparing the HPLC response from iohexol sample to the response of the iohexol certified standard at a similar concentration, the peak area ratio of sample to certified standard can provide a quick concentration and purity analysis.
The equation to calculate the concentration ratio of iohexol is shown below:

The HPLC chromatograms of iohexol sample and certified reference are shown in Figure 3A and 3B.
The averaged value of summed two peak areas is 714 for iohexol sample (Figure 3A), and 740 for iohexol reference standard (Figure 3B). With the calculation of concentration ration, the calculated concentration of iohexol in the sample is 0.0964 mg/ml which equals a purity of 96.4% – in line with the stated product purity of ≥ 95%.
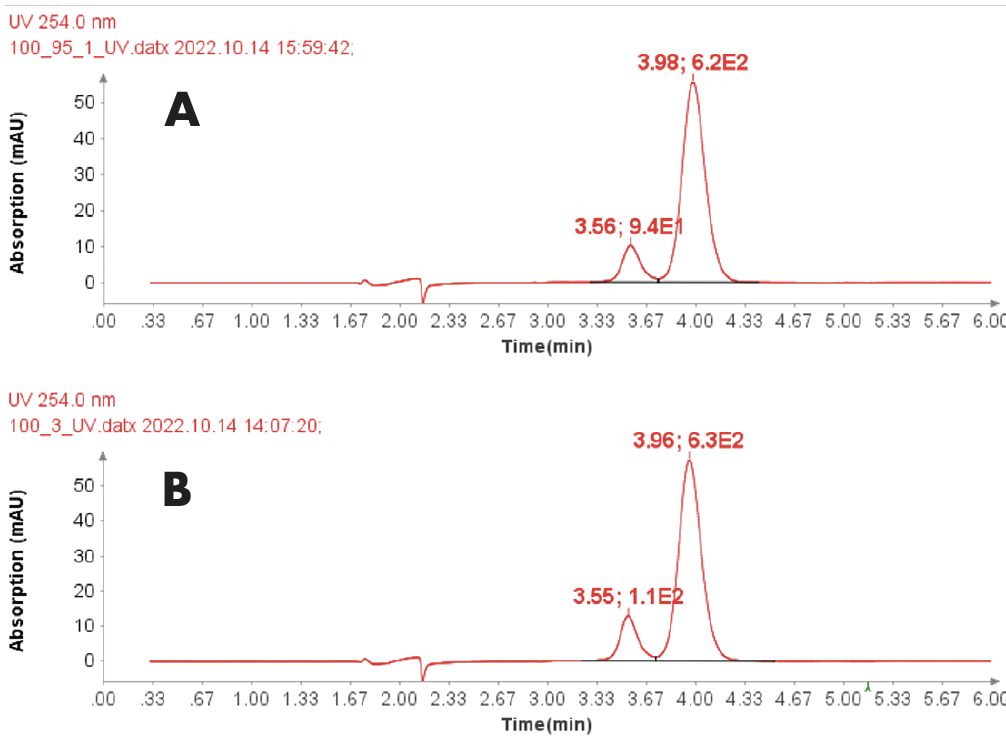
Figure 3: (A) HPLC chromatogram (254 nm) of iohexol sample (0.1 mg/ml) (B) HPLC chromatogram (254 nm) of iohexol reference standard (0.1 mg/ml).
Quantitation by HPLC/UV Analysis
To check the purity of an iohexol sample more accurately, a calibration curve of iohexol certified standard material was created with five different dilution levels from 25 to 500 μg/mL and with triplicate injections for each concentration. The R-squared value of the resulting linear calibration function is 0.9999 (Figure 4) showing excellent linearity.
By way of the iohexol calibration curve approach, the purity of the iohexol sample was determined to be 97.5%.
This value is also right above the stated purity of min 95% of the sample and differs by only 1.1% from the measured value by direct UV response ratio analysis of the iohexol sample to iohexol reference standard.
Both purity determination by way of a calibration function or by direct UV response ratio analysis can be used for organic chemicals with UV absorbances if certified reference standard material is available.
The calibration function method will provide a more accurate measurement.
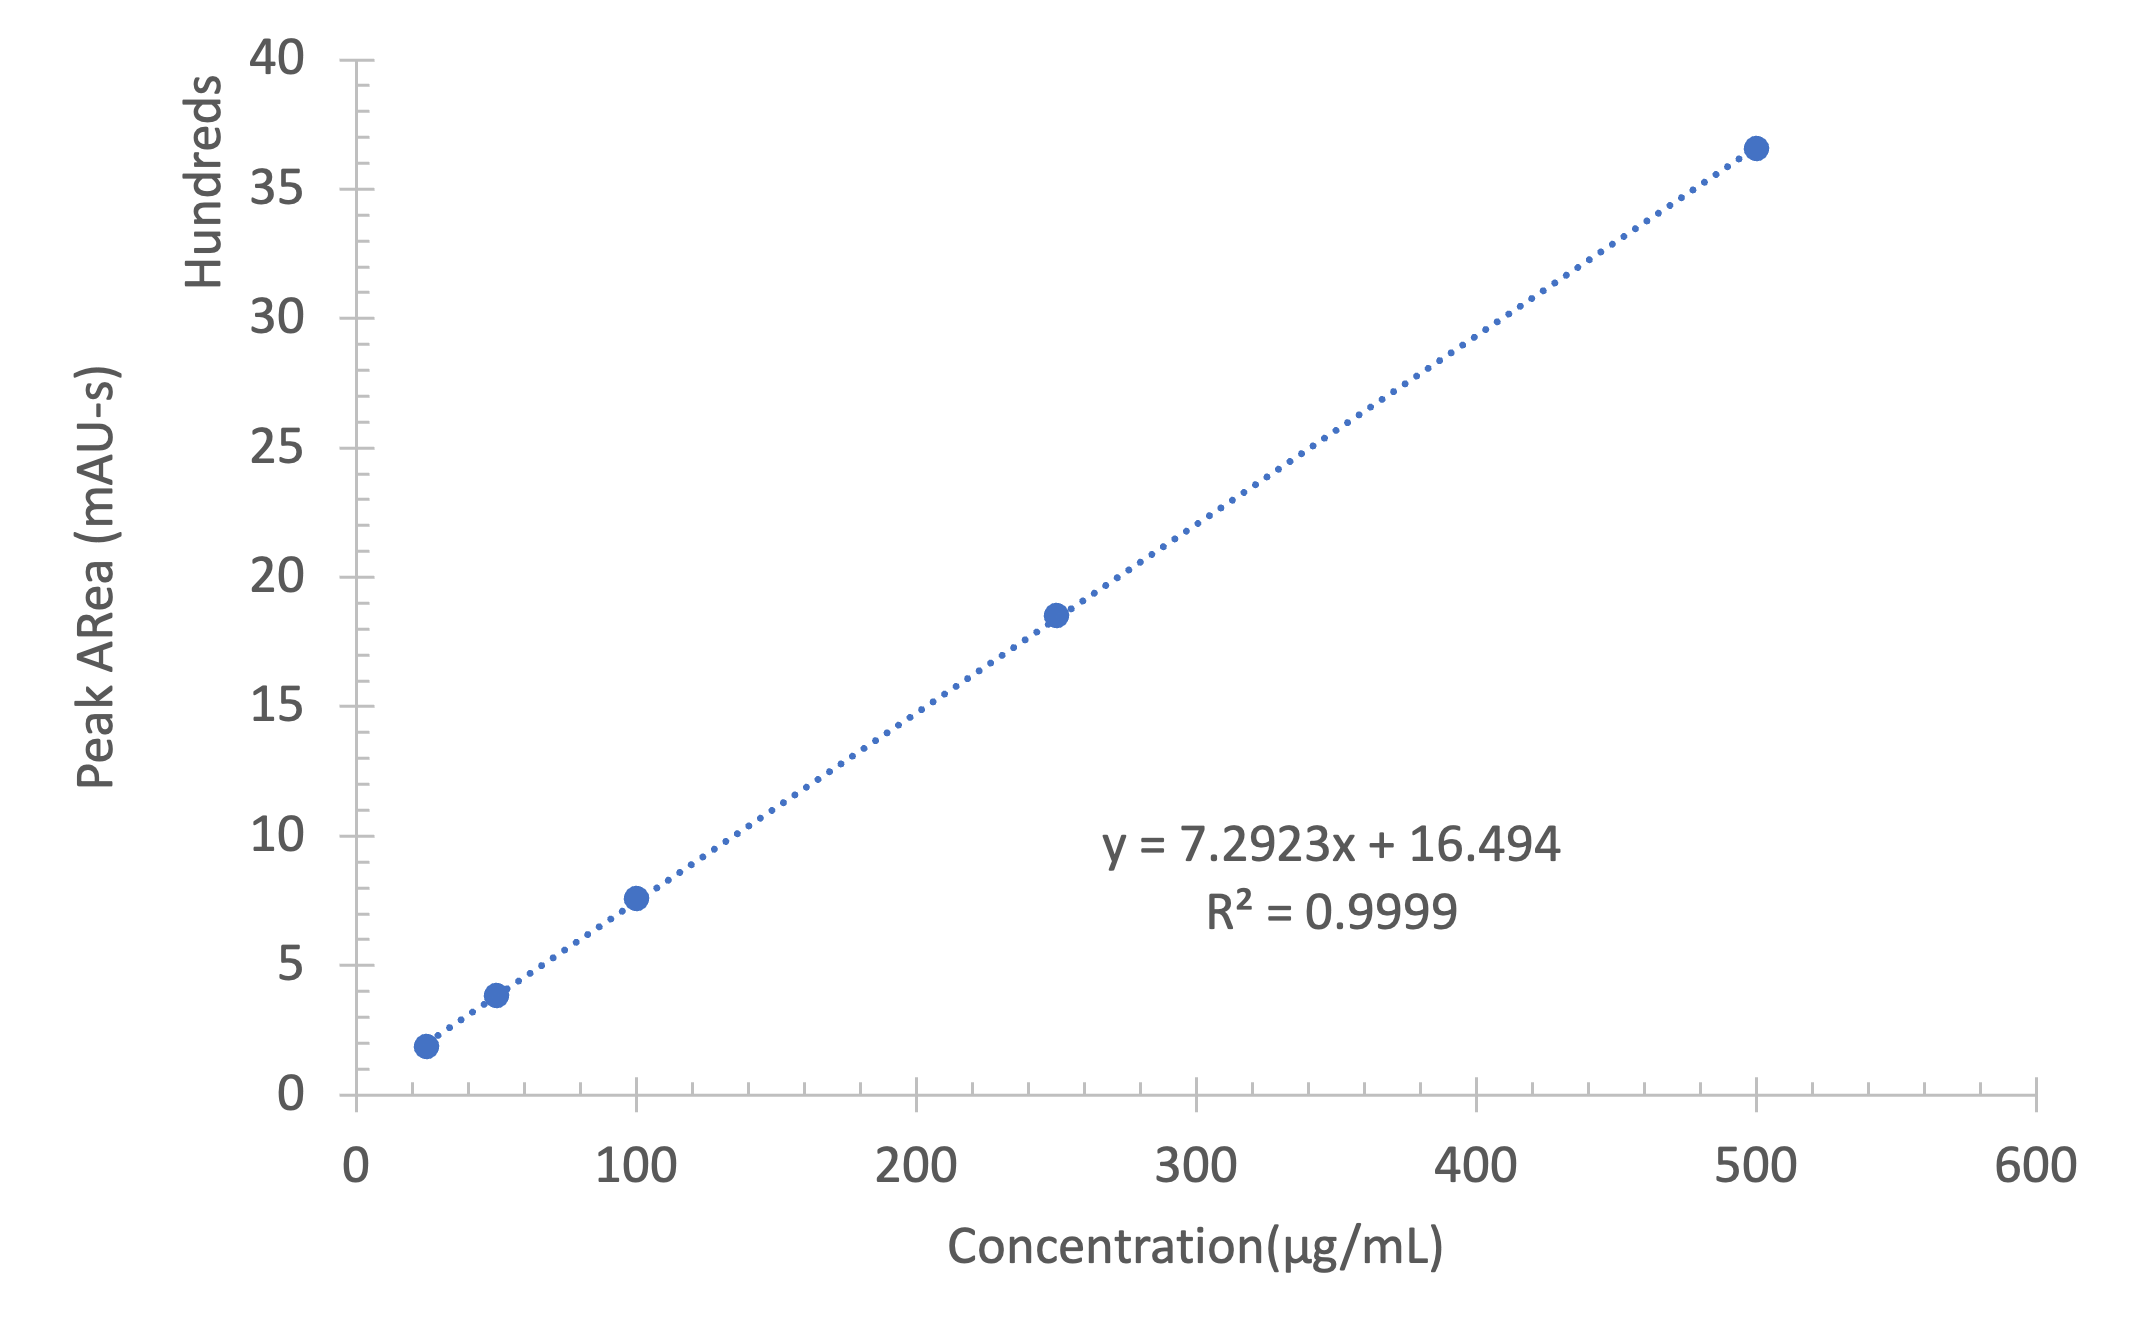
Figure 4: Calibration curve of iohexol by HPLC chromatogram (254 nm)
Conclusion
The Advion Interchim Scientific AVANT® (U)HPLC system can provide accurate chromatographic methods for the purity analysis of imaging agents as shown for iohexol. Coupling UHPLC with the Advion Interchim Scientific expression® Compact Mass Spectrometer not only provides confirmations of target compounds via their mass and in-source fragmentation pattern, but also allows for rapid determination of impurities.
REFERENCES
[1] T. Almen, Development of nonionic contrast media., Invest. Radiol. (1985) Investigative Radiology. 1985, 20(1), S2-S9.
[2] R.D. Moore, E.P. Steinberg, N.R. Powe, R.I. White, J.A. Brinker, E.K. Fishman, S.J. Zinreich, C.R. Smith, Frequency and determinants of adverse reactions induced by high-osmolality contrast media., Radiology. 1989, 170, 727-32.