Classifying Cheeses by Volatile APCI (vAPCI) Compact Mass Spectrometry
Mass Spec: expression® CMS
Sampling: vAPCI
INTRODUCTION
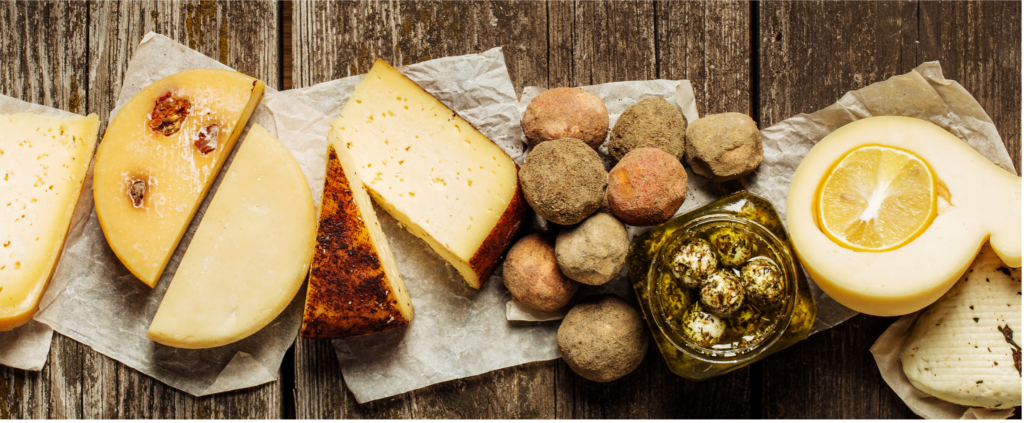
Cheese is one of the world’s most popular food types, with a wide variety available for consumers. We commonly eat cheeses from cows, goats, and sheep. The scents and flavors of cheeses, so characteristic to each type of cheese, stem from a complex mixture of chemicals, including free fatty acids. While this mixture is affected by a wide variety of factors we can use the mass spectra to characterize the volatile profiles of different types of cheeses.

In this application note, we demonstrate the capability of the Advion expression® CMS to analyze volatile fatty acids of various types of cheeses using our volatile APCI (vAPCI) ion source. By heating the cheese samples, we released various volatile compounds, mainly fatty acids, and analyzed the headspace without any sample preparation or derivatization. We then performed statistical analysis to group the cheese samples by their different volatile profiles.
METHODS
Several cheeses of different types were warmed in vessels to 70°C for 2 hours, and the headspaces of the vessels were analyzed using the CMS with a vAPCI ion source, using solvent flow (10 mM4NH4OAc in 1:1 MeOH:H2O) to aid in ionization.
While the cheese samples contained many of the same fatty acids, ions invisible to the naked eye will provide the required information to separate the profiles for each cheese. To look for these differences we performed principle component analysis (PCA) on the mass spectra.

Figure 3: A selection of fatty acids commonly found in different cheese.
RESULTS AND DISCUSSION
The mass spectra show that a wide variety of fatty acids evolve from each of the cheese samples when warmed (Figure 3). Each cheese sample contained many of the same fatty acids (Table 1).

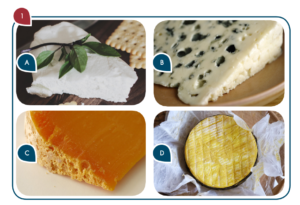
Figure 4: Mass spectra of representative samples of four types of cheese: (A) Goat Cheese, (B) Blue Stilton, (C) Red Leicester, and (D) Wensleydale.
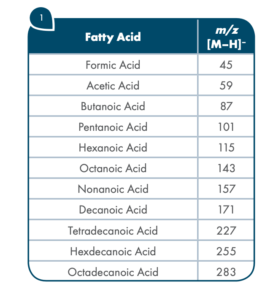
Table 1: Fatty acids observed using vAPCI analysis of cheese samples.
PCA is a statistical tool that is used to look for patterns in data. The resulting plot (Figure 6) shows grouping based on how similar or different samples are from each other. By performing PCA on the data from several samples of each type of cheese, we found that the different cheeses indeed can each be grouped together based on their mass spectra allowing rapid identification using vAPCI analysis. For example, the various goat cheeses had statistically similar spectra and are thus grouped together on the PCA plot. This is generally true of each type of cheese.

Figure 6: PCA of cheese volatile profiles.
The mass spectra of each type of cheese were characteristic; not only were the spectra for cheese samples similar within each type of cheese, but they were substantially different between the different types of cheeses analyzed.
CONCLUSIONS
We used the Advion expression® CMS with a vAPCI ion source to analyze the fatty acids in vapor given off by warmed cheese samples without any additional sample preparation or derivatization. Additionally, we used PCA to show that the spectra of each type of cheese is characteristic to that type of cheese, which allows us to classify the different cheese samples by their type. This would further allow us to identify cheeses by their type using a simple volatile mass spectrometry set up.