Mass Directed Fraction Collection of Natural Products: Examples from Turmeric and Green Tea Extract
Flash: puriFlash® 5.250
Mass Spec: expression® CMS
Sampling: ASAP® probe
Introduction
Flash chromatography has traditionally used UV absorption as the main method of detection for compounds during a purification process. While UV absorption is broadly applicable to many classes of compounds, it has limited specificity to individual compounds in a mixture and misses classes of compounds that do not carry chromophores.
Mass-directed fraction collection gives users the ability to collect fractions based on mass spectrometry detection (MS) which is based on ions specific to individual compounds and provides specific molecular information. This allows for simplification in the overall purification process and greater confidence in the identity of each isolated compound.
Here we describe methods of isolating natural products from green tea and turmeric powder by mass-directed fraction collection during flash chromatography and preparative LC. For demonstration purposes, the isolated compounds were then additionally confirmed by Atmospheric Solids Analysis Probe (ASAP®) MS or HPLC-MS.
Introduction to Curcuminoids
Curcumin is the main curcuminoid found in turmeric root (Curcuma longa). It is commonly used as an ingredient in dietary supplements and cosmetics, flavoring in culinary dishes, and a yellow-orange food coloring. Curcuminoids have been reported as having antioxidant and anti- inflammatory activities.
Store-bought turmeric powder (57.3 g) was extracted in ethanol, then filtered through filter paper, and concentrated. This yielded a crude extract oil of 6.4 g containing the three curcuminoids of interest (also compare TLC analysis in Figure 4).
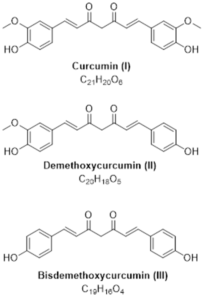
Figure 1: Structures of the curcuminoids of interest.
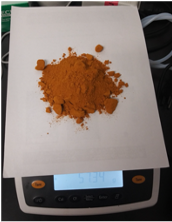
Figure 2: Store-bought turmeric powder.
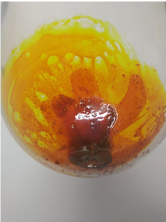
Figure 3: Crude extract oil from turmeric powder.
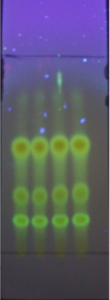
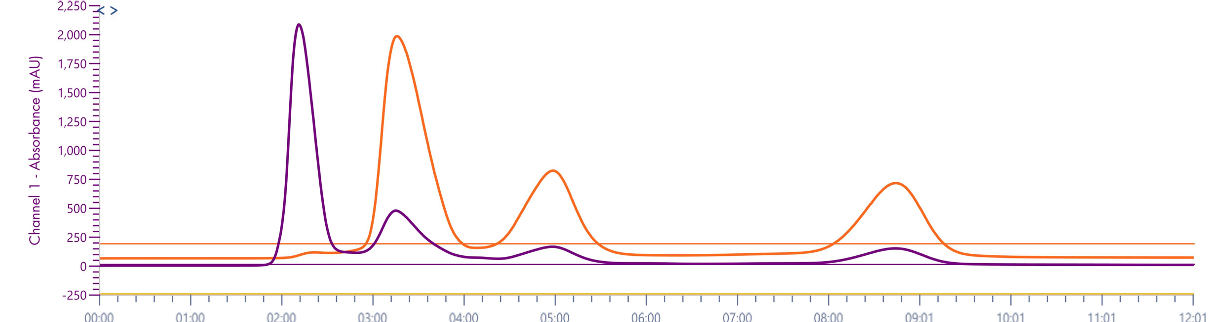
Figure 4: TLC analysis at 365 nm of turmeric extract (97:3 DCM:MeOH) and the chromatogram of the method transferred to the puriFlash® 5.250 using UV detection.
Method Development
The turmeric extract was first analyzed on a TLC plate and then the method transferred to the puriFlash® 5.250 system using UV detection at two wavelengths. Four compounds were detected at 254 nm with three assumed curcuminoids detected at 427 nm, however, there is no specificity for the individual compounds in UV detection.
An isocratic method (97:3 dichloromethane:methanol) was used as the separation shown on TLC was optimal. The crude material was purified on a 12g, 15 μm spherical silica gel column (PF-15SIHC-F0012). A crude weight of 32 mg was dry-loaded onto 250 mg of silica gel and loaded into a 4g dryload cartridge (PF- DLE-F0004). Fractions were collected using the XIC channels for each compound of interest.
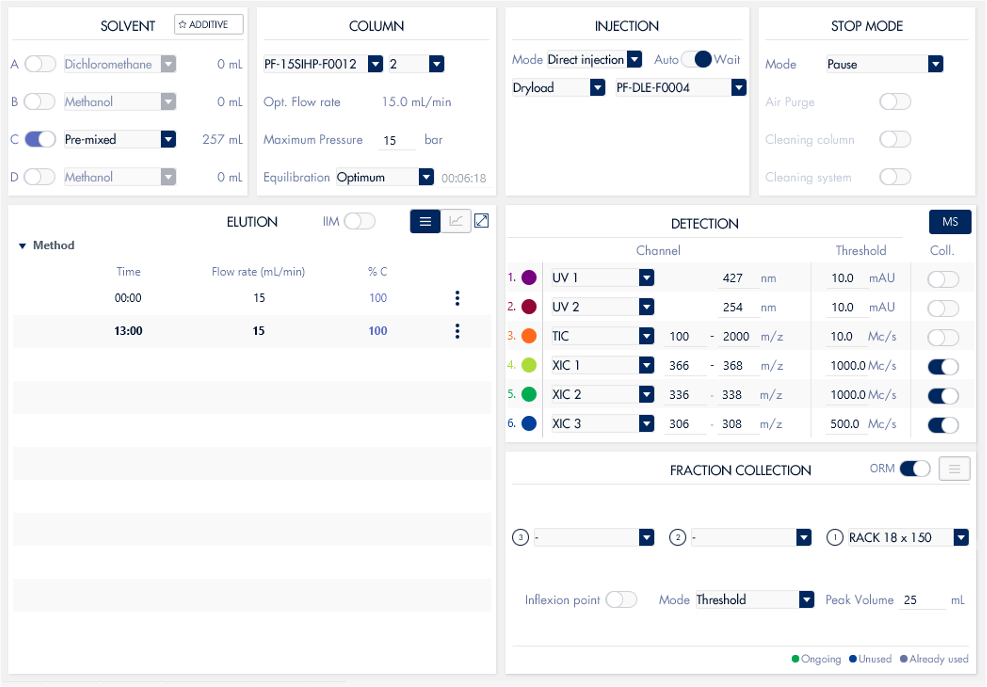
Figure 5: Screenshot of the flash chromatography method run with parameters.
The mass spectrometer settings are controlled through the InterSoft®X software on the puriFlash® system. The mass spectrometer was fitted with an APCI source and run with negative ionization acquisition mode.
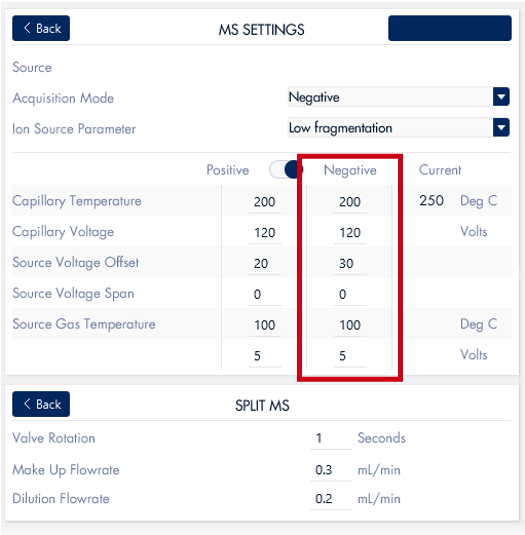
Figure 6: Screenshot of the mass spectrometer parameters for chromatography run.
Experiment
Mass-Directed Fraction Collection
The extracted ion chromatogram (XIC) created by plotting the intensity of the observed signal at a chosen mass-to- charge value. This allows for a low-noise signal of compounds of interest. Here the XIC channels are set to detect the three curcuminoids of interest.
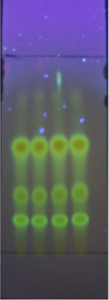
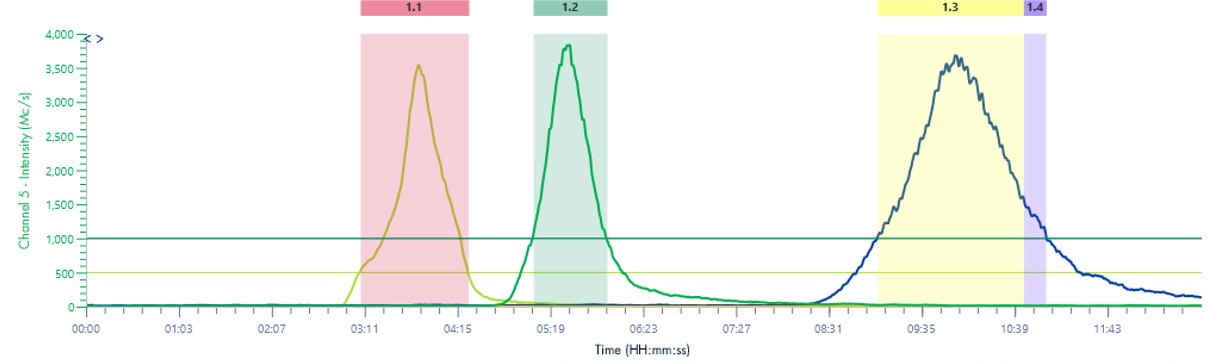
Figure 7: TLC Analysis of turmeric extract (97:3 DCM:MeOH) and chromatogram of method transferred to the puriFlash® 5.250 using MS XIC detection.
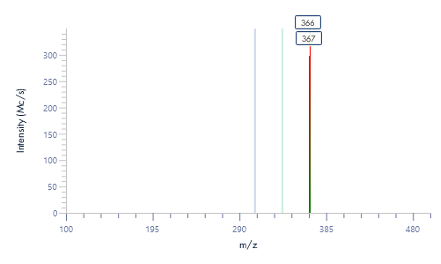
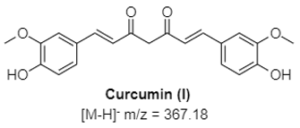
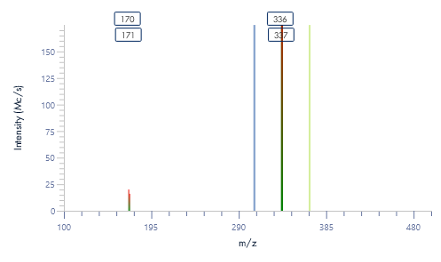
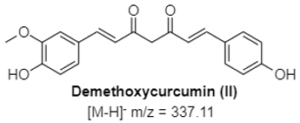
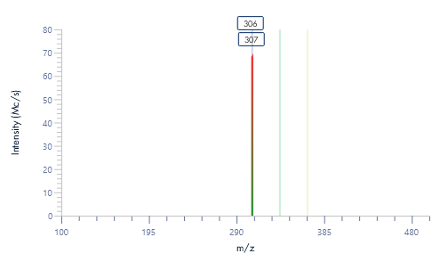
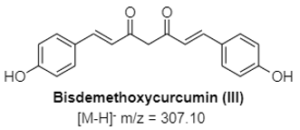
Figure 8: The mass spectra for each peak as provided by the puriFlash® InterSoft®X software.
ASAP® MS Fraction Confirmation
The pure fractions (1.1, 1.2, and combined 1.3 and 1.4) were additionally analyzed using ASAP® negative polarity MS. The detected masses are consistent with the theoretical [M-H]- m/z values.
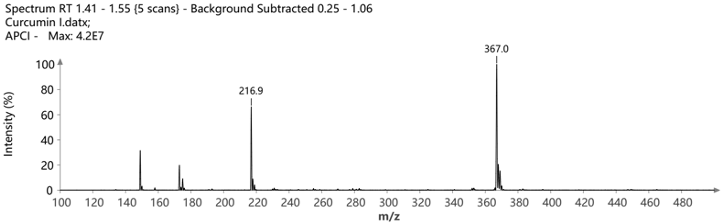
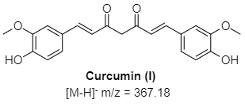
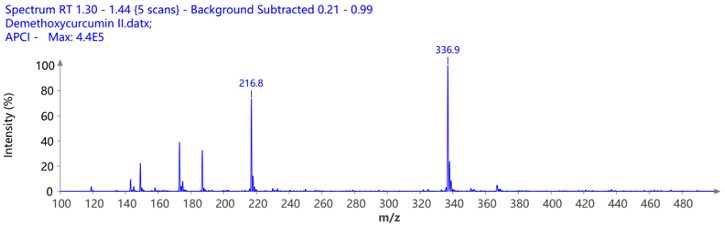
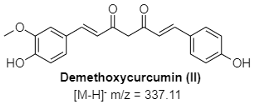
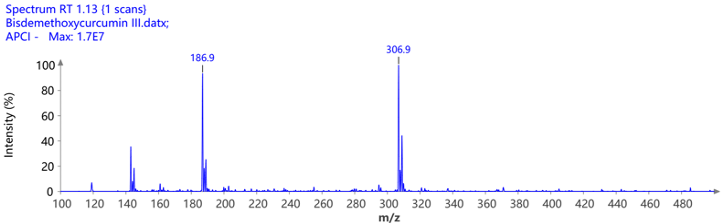
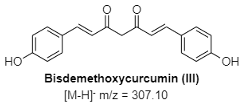
Figure 9: The mass spectra of the isolated compounds confirming their identity and purity.
Introduction, Green Tea Catechins
Dry green tea typically consists of 10-30% of polyphenols based on dry weight with catechins being the major tea polyphenols including: (−)-epigallocatechin (EGC), (−)-epigallocatechin-3-gallate (EGCG), (−)-epicatechin- 3-gallate (ECG) and (−)-gallocatechin gallate (GCG). EGCG is the most abundant and biologically active catechin, separating and purifying catechins from raw tea extract can greatly increase their market availability and value.
Dry green tea leaves were extracted into hot water, then partitioned with ethyl acetate, filtered through filter paper, and evaporated to give a crude extract. The dry extract was then dissolved in 7.5 mL of water and filtered with 0.2 μm filter before further processing.
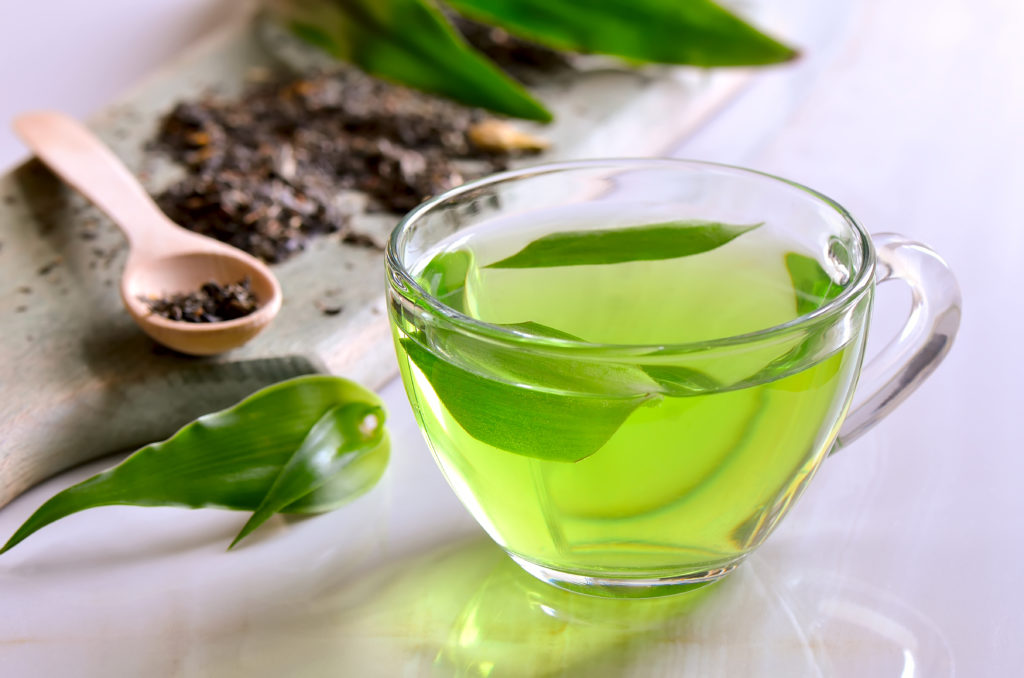
Figure 10: Green tea leaves steeping.
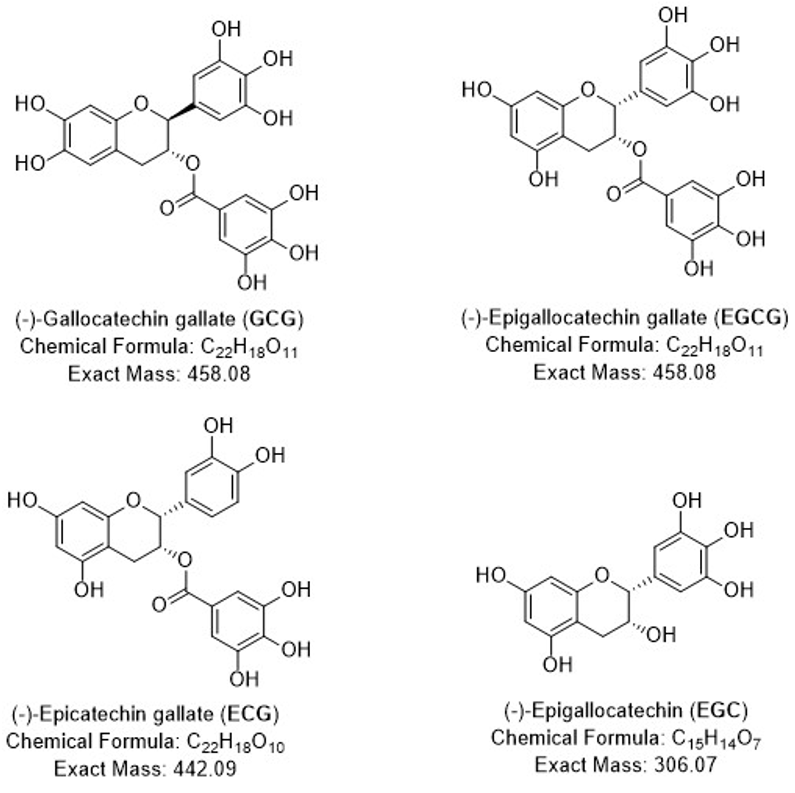
Figure 11: Major Catechins in Green Tea.
Method Development
With HPLC-UV/MS analysis, EGC, EGCG, GCG, EC and ECG are detected in the tea extract (Figure 12).
Solvent A: Water
Solvent B: Methanol
UV: 275 nm
MS: full scan from 150-900
Column: US15C18HP-250/046
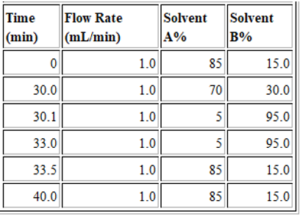
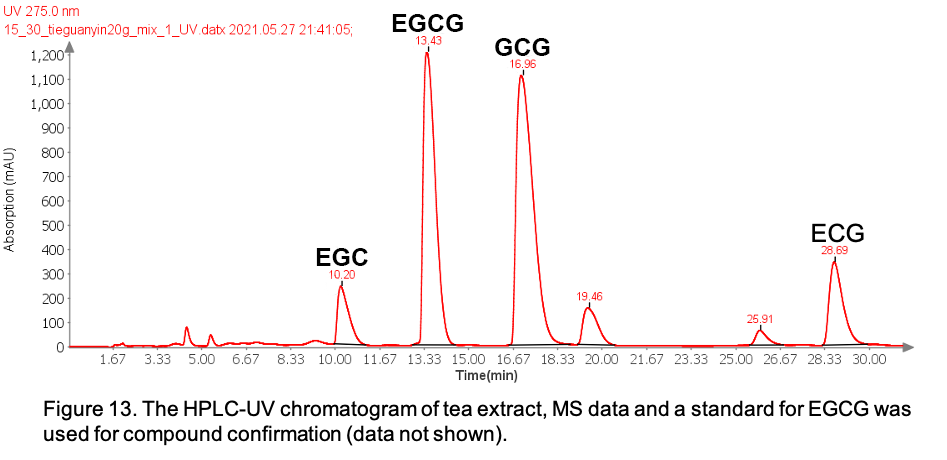
Figure 12: The HPLC-UV chromatogram of green tea extract, MS data and a standard for EGCG was used for compound confirmation (data not shown).
The mass spectrometer settings are controlled through the InterSoft®X software on the puriFlash® system. The mass spectrometer was fitted with an ESI source and run with negative ionization acquisition mode.
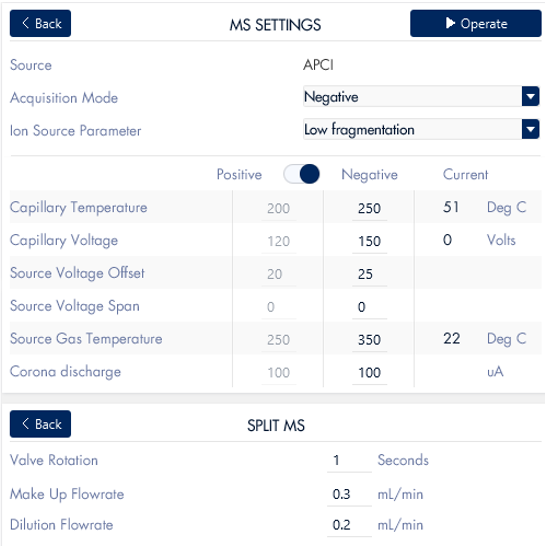
Figure 13: Screenshot of the mass spectrometer parameters for chromatography run.
Mass-Directed Fraction Collection
Here the XIC channels are set to detect the 4 catechins of interest. EGCG and CGC are isomers and therefore share the same mass.
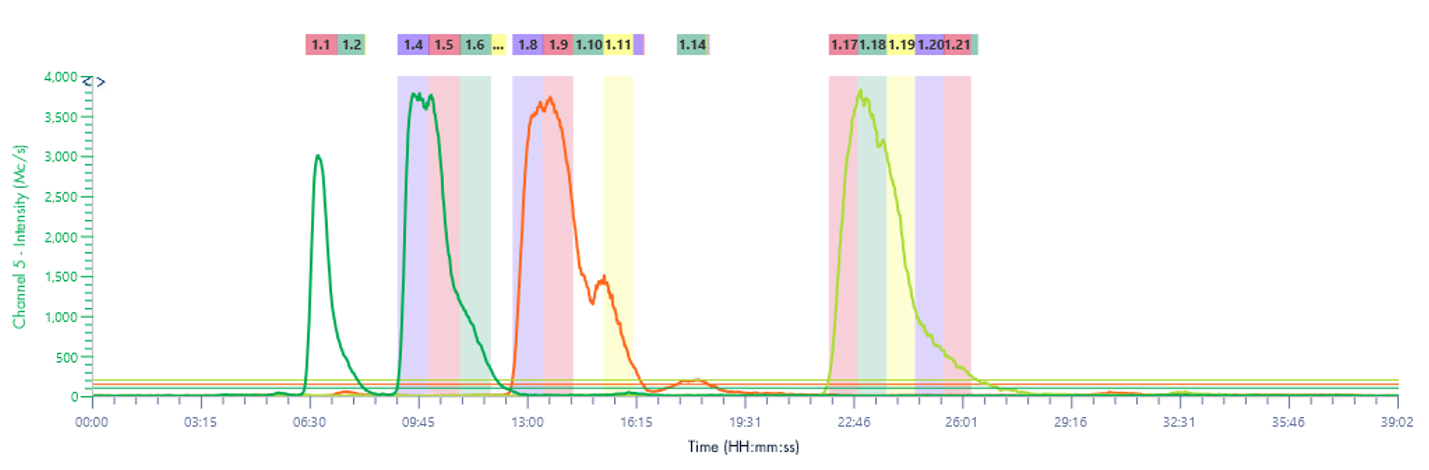
Figure 14: Chromatogram of the method transferred to the puriFlash® 5.250 using MS XIC detection.
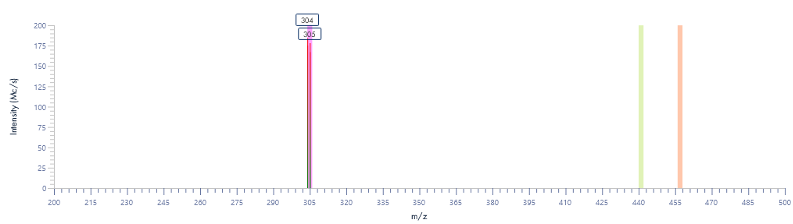
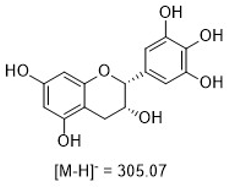
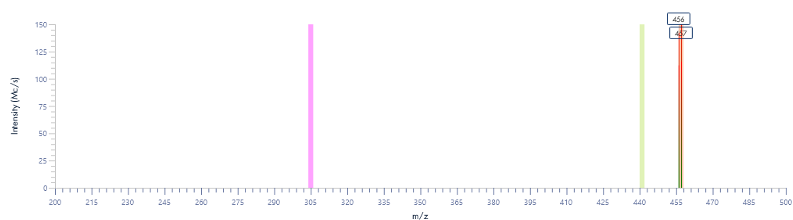
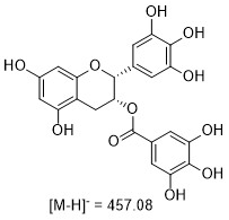
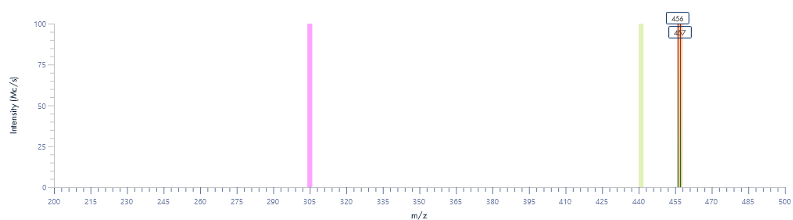
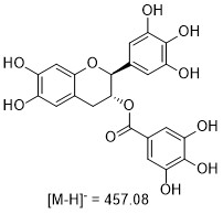
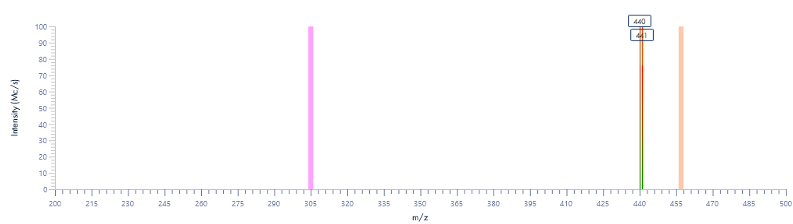
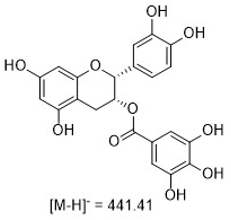
Figure 15: The mass spectra for each peak as provided by the InterSoft®X software.
Conclusion
• With natural products isolation, one of the biggest challenges is the identification of compounds of interest in complex extract mixtures.
• Using MS and chromatography in tandem we can separate and identify compounds in a complex mixture with a high degree of purity and accuracy without the need for further identification of fractions collected.
• The fractions collected can be characterized directly through the MS data provided by the InterSoft®X software on the puriFlash® systems.
• The puriFlash® 5.250 and expression® CMS make a powerful duo in the purification and identification of natural products such as the catechins found in green tea and the curcuminoids found in turmeric.