Efficient Reaction Monitoring with Advion Interchim Scientific ASAP-CMS for Compounds Requiring Polarity Switching in Medicinal Chemistry

Instrumentation:
Mass Spec: expression® CMS
Sampling: Atmospheric Solids Analysis Probe – ASAP®
Software: MassExpress

Authors
Changtong Hao, Ph.D.
Advion Interchim Scientific

Introduction
In medicinal chemistry, rapid and reliable analytical techniques are crucial for the discovery of new drug products. Mass spectrometry (MS) is a key technique for reaction monitoring that provides essential molecular information about a product at each stage of discovery.

Medicinal chemists often encounter specific challenges when monitoring reactions, such as:
– Ionization Mode Ambiguity: The lack of prior information on the optimal ionization mode (positive or negative) can lead to incomplete data.
– Developing separate methods for each ionization mode may delay progress in a fast-paced field that demands quick insights.
– Limited access to specialized instruments or expertise can also hinder analysis.

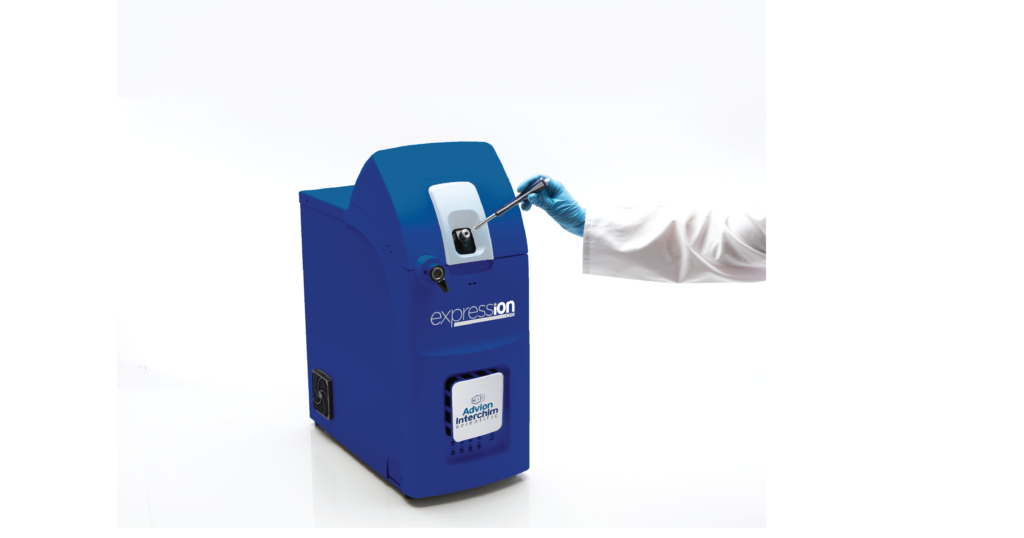
Advion Interchim Scientific System
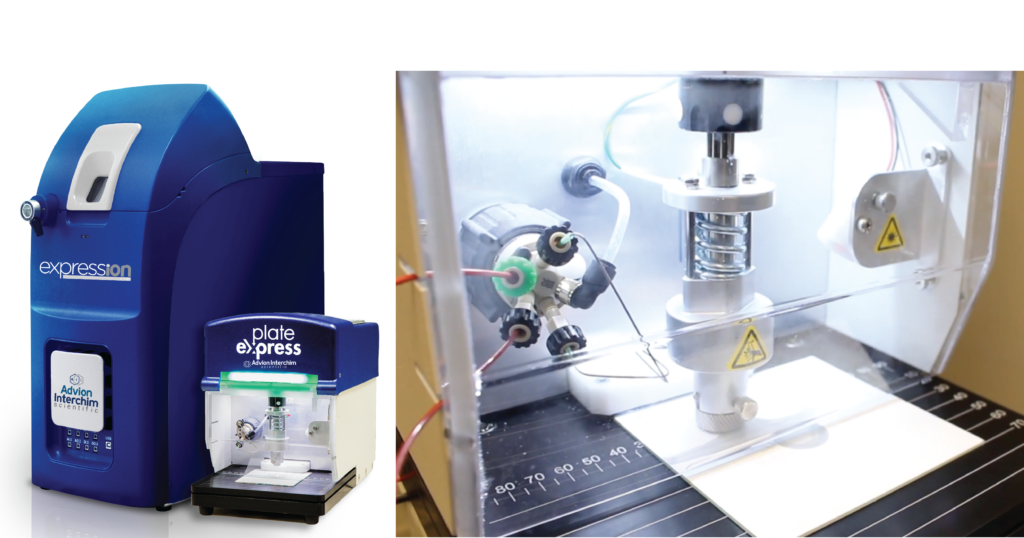
expression® CMS with Atmospheric Solids
Analysis Probe (ASAP®)

Method
The Advion Interchim Scientific® Atmospheric Solids Analysis Probe (ASAP®), integrated with the expression® Compact Mass Spectrometer (CMS) and MassExpress software, uses rapid polarity switching and versatile sample introduction techniques to offering an innovative solution to these challenges:

Rapid Polarity Switching: Seamlessly transitions between positive and negative ion modes, ensuring comprehensive data capture without method changes.
Versatile Sample Introduction: Atmospheric Solids Analysis Probe (ASAP®) enables direct analysis of solid and liquid samples, reducing preparation time.
Enhanced Data Integrity: Accurate identification of compounds with distinct ionization preferences minimizes the risk of missing critical information.

Here is the case where chemist cannot get a successful detection with their traditional LC-MS analysis of the reaction Monitoring with Dual Polarity Detection.

Scenario: Differentiating between a reactant and its product, each exhibiting exclusive ionization behavior.
Reactant (C5H2Br2O2S): Detectable only in negative ion mode, showing peaks at m/z 282.8, 284.8, and 286.8 displaying a characteristic 1:2:1 bromine isotopic pattern.
Product (C6H4Br2O2S): Undetectable in negative ion mode but clearly observed in positive ion mode at m/z 298.8, 300.8, and 302.8, also displaying the same classic 1:2:1 bromine isotopic distribution.


Figure 1: Reaction Path


Figure 2: A top). MS spectrum of starting material in negative mode. B bottom). MS spectrum of product in positive mode.

Using the Advion Interchim Scientific’s ASAP-MS’s rapid polarity switching feature, both compounds were accurately identified within a single analytical workflow and without the need of HPLC separation. Total elapsed time of the analysis was <1 minute for the samples and this technique allows the reaction to be monitored over time.

Conclusion
The Advion Interchim Scientific® ASAP-MS, with its rapid polarity switching and efficient and versatile sample introduction via the Atmospheric Solids Analysis Probe (ASAP®), empowers medicinal chemists to monitor reactions with confidence. The robust system ensures that no critical data is overlooked, streamlining drug discovery workflows and enhancing decision-making processes. Harness the power of dual polarity detection with Advion Interchim Scientific® ASAP-MS—because every detail matters in the mission of drug discovery.

Extraction and Purification of 3 Curcuminoids from Turmeric Powder

Instrumentation:
Flash: puriFlash® XS520
TLC: Plate Express TLC Plate Reader
Mass Spec: expression® Compact Mass Spectrometer
Sampling: ASAP® Direct Analysis Probe

Introduction

Curcuminoids are natural polyphenol compounds derived from turmeric root (Curcuma longa). They are reported to have antioxidant activities1. Curcumin is the main curcuminoid found in turmeric. It is commonly used as an ingredient in dietary supplements and cosmetics, flavoring in culinary dishes, and a yellow-orange food coloring.

In this application note, a method to separate and purify 3 curcuminoids from turmeric powder using flash chromatography with the Advion Interchim Scientific puriFlash® XS520 Plus, TLC with mass spectrometry with the Plate Express™ TLC Plate Reader and expression® CMS is demonstrated. Fractions were identified using the Atmospheric Solids Analysis Probe (ASAP®).

Curcuminoid Extraction

The turmeric powder was weighted out (57.3 g) and transferred to a wide mouth glass bottle. Ethanol (250 mL, 200 proof) was added to the bottle and the mixture was stirred for 18 hours while covered with foil. The compounds of interest are sensitive to light. The slurry was then filtered and the filtrate was concentrated to dryness to form an amber oil (6.4 g).

Figure 1: Structures of curcuminoids.

Figure 2: Store-bought turmeric powder (left) and crude extract oil (right).

TLC/MS Analysis

The Advion Interchim Scientific Plate Express™ paired with the expression® CMS allows for easy identification of spots on TLC plates without the need for purification or sample preparation (Figure 3).

Initial TLC analysis showed 4 spots (dichloromethane:methanol, 97:3). The three lower spots were highly fluorescent, as expected for the curcuminoids of interest. TLC spots were analyzed by APCI ionization in negative ion mode. The bottom 3 spots were characterized by mass spectrometry.

Figure 3: Advion Interchim Scientific expression® CMS and Plate Express™ TLC Plate Reader (left) and close up of the TLC plate extraction head (right).

Figure 4: Developed TLC plate visualized at 365 nm. Resulting mass spectra of cur cumin (top), demethoxycurcumin (middle), and bisdemethoxycurcumin (bottom).

Flash Purification

An isocratic method was used as the separation shown on TLC was optimal as is. The crude material was purified on a 25 g, 15 μm spherical silica gel column (PF-15SIHC-F0025). A crude weight of 64 mg was dry-loaded onto 500 mg of silica gel and loaded into a 4 g dryload cartridge (PF-DLE-F0004).

Figure 5: Resulting flash chromatogram from developed TLC Plate.

Fraction Identification by ASAP®/CMS

The expression® CMS with the ASAP® Direct Analysis Probe allows for easy identification of compounds without the need for LC/MS or sample make-up.

The pure fractions (1.1, 1.3, and 1.5) were analyzed using the ASAP® probe with APCI ionization and positive polarity CMS. The curcuminoids ionize well in both APCI positive and negative polarity, however (M+H)+ ions showed less fragmentation. The detected masses are consistent with the theoretical [M+H]+ m/z values.

Figure 6: Advion Interchim Scientific ASAP® Direct Analysis Probe being inserted directly into the APCI-enabled ion source of the expression® CMS.

Figure 7: Mass spectra of fractions.

The purified fractions were concentrated to dryness to give solids I (14.1 mg), II (5.6 mg) and III (6.7 mg) respectively, which represents Curcumin (I), demethoxycurcumin (II), and bisdemethoxycurcumin (III) at 53.4%, 21.2%, and 25.3% of the isolated curcuminoid profile. These results are consistent with reported literature values2.

Confirmation of Compound Purity by RP-HPLC

Figure 8: UV Scan of purified fraction mixture.

Reverse Phase High Performance Liquid Chromatography (RP-HPLC) allows for a separate confirmation of compound purity after flash chromatography. An equal mixture of all three compounds was combined and run on a Phenomenex Kinetex® 5 μm Biphenyl 100 Å 50 x 2.1 mm column using isocratic ACN:Water (v:v, 55:45) with 0.2% formic acid. As expected, the elution order of the three curcuminoids changed order with now eluting III, II and I (Figure 8). After developing this method, the respective single collected fraction was injected and analyzed for purity and again confirmed by MS analysis.

Figure 9: UV Scan and mass spectrum of Curcumin Fraction 1.1.

Figure 10: UV Scan and mass spectrum of Curcumin Fraction 1.3.

Figure 11: UV Scan and mass spectrum of Curcumin Fraction 1.5.

Conclusion

With a combination of TLC chromatography, flash chromatography and mass spectrometry support at various stages of the process (TLC plate identification, fraction confirmation and secondary purity analysis), we can purify curcuminoids from Turmeric powder at confirmed purity levels of >95%.

References:
1Jayaprakasha et al. Antioxidant activities of curcumin, demethoxycurcumin and bisdemethoxycurcumin. Food Chemistry, Volume 98, Issue 4, 2006, Pages 720-724. ps://doi.org/10.1016/j.foodchem.2005.06.037.
2Praveen et al. Facile NMR approach for profiling curcuminoids present in turmeric, Food Chemistry, Volume 341, Part 2, 2021, 128646, https://doi.org/10.1016/j. foodchem.2020.128646.