Extraction and Purification of 3 Curcuminoids from Turmeric Powder

Instrumentation:
Flash: puriFlash® XS520
TLC: Plate Express TLC Plate Reader
Mass Spec: expression® Compact Mass Spectrometer
Sampling: ASAP® Direct Analysis Probe

Introduction

Curcuminoids are natural polyphenol compounds derived from turmeric root (Curcuma longa). They are reported to have antioxidant activities1. Curcumin is the main curcuminoid found in turmeric. It is commonly used as an ingredient in dietary supplements and cosmetics, flavoring in culinary dishes, and a yellow-orange food coloring.

In this application note, a method to separate and purify 3 curcuminoids from turmeric powder using flash chromatography with the Advion Interchim Scientific puriFlash® XS520 Plus, TLC with mass spectrometry with the Plate Express™ TLC Plate Reader and expression® CMS is demonstrated. Fractions were identified using the Atmospheric Solids Analysis Probe (ASAP®).

Curcuminoid Extraction

The turmeric powder was weighted out (57.3 g) and transferred to a wide mouth glass bottle. Ethanol (250 mL, 200 proof) was added to the bottle and the mixture was stirred for 18 hours while covered with foil. The compounds of interest are sensitive to light. The slurry was then filtered and the filtrate was concentrated to dryness to form an amber oil (6.4 g).

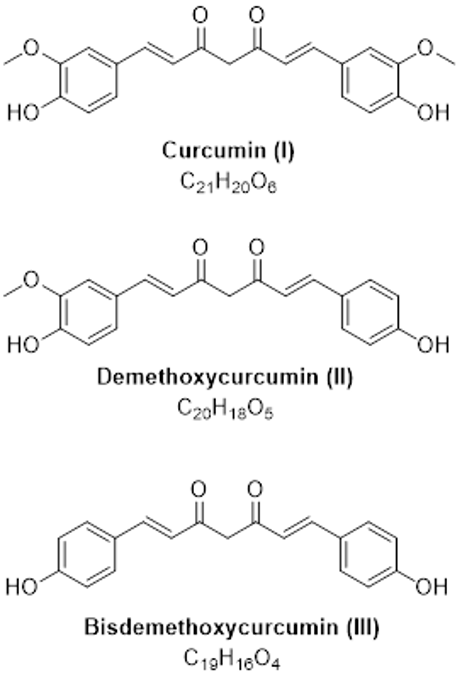
Figure 1: Structures of curcuminoids.

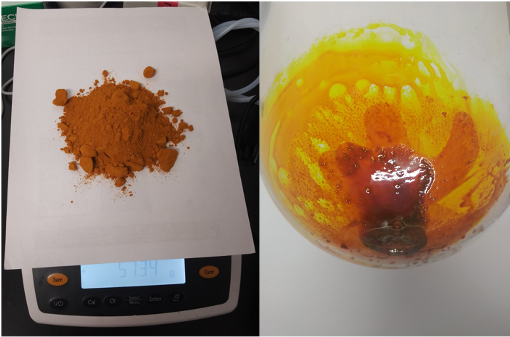
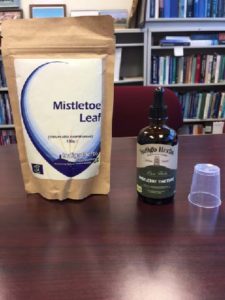
Figure 2: Store-bought turmeric powder (left) and crude extract oil (right).

TLC/MS Analysis

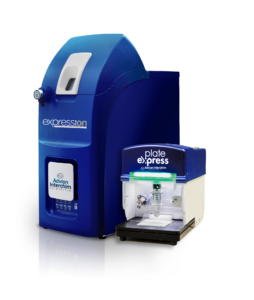
The Advion Interchim Scientific Plate Express™ paired with the expression® CMS allows for easy identification of spots on TLC plates without the need for purification or sample preparation (Figure 3).

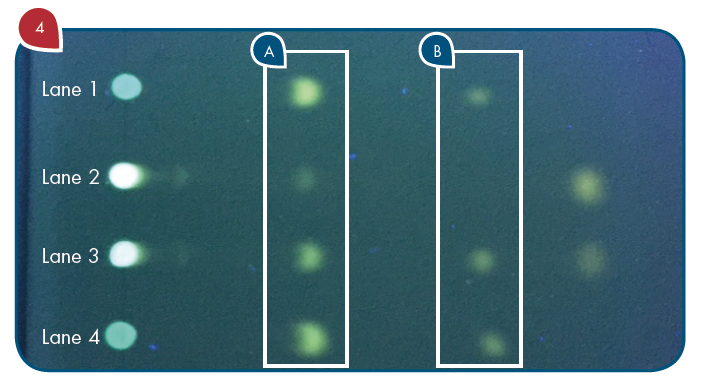
Initial TLC analysis showed 4 spots (dichloromethane:methanol, 97:3). The three lower spots were highly fluorescent, as expected for the curcuminoids of interest. TLC spots were analyzed by APCI ionization in negative ion mode. The bottom 3 spots were characterized by mass spectrometry.

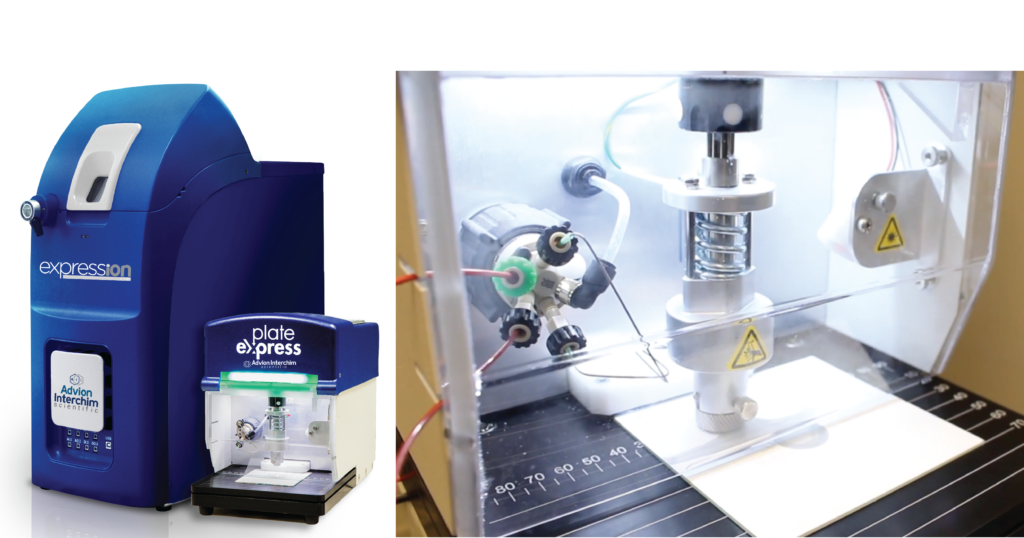
Figure 3: Advion Interchim Scientific expression® CMS and Plate Express™ TLC Plate Reader (left) and close up of the TLC plate extraction head (right).

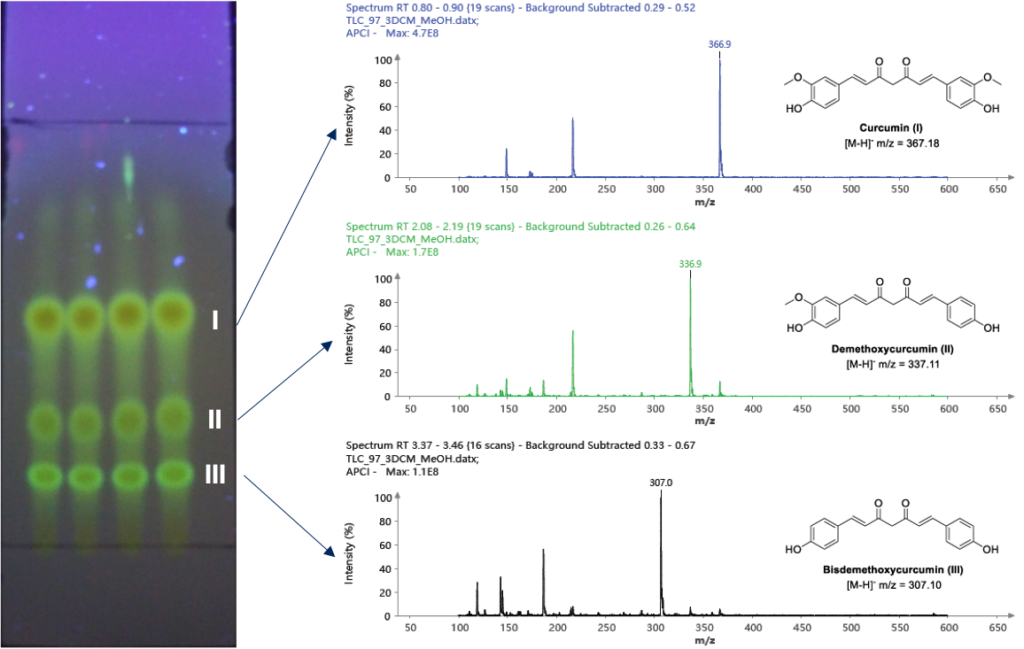
Figure 4: Developed TLC plate visualized at 365 nm. Resulting mass spectra of cur cumin (top), demethoxycurcumin (middle), and bisdemethoxycurcumin (bottom).

Flash Purification

An isocratic method was used as the separation shown on TLC was optimal as is. The crude material was purified on a 25 g, 15 μm spherical silica gel column (PF-15SIHC-F0025). A crude weight of 64 mg was dry-loaded onto 500 mg of silica gel and loaded into a 4 g dryload cartridge (PF-DLE-F0004).

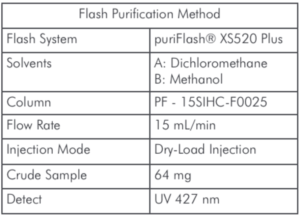
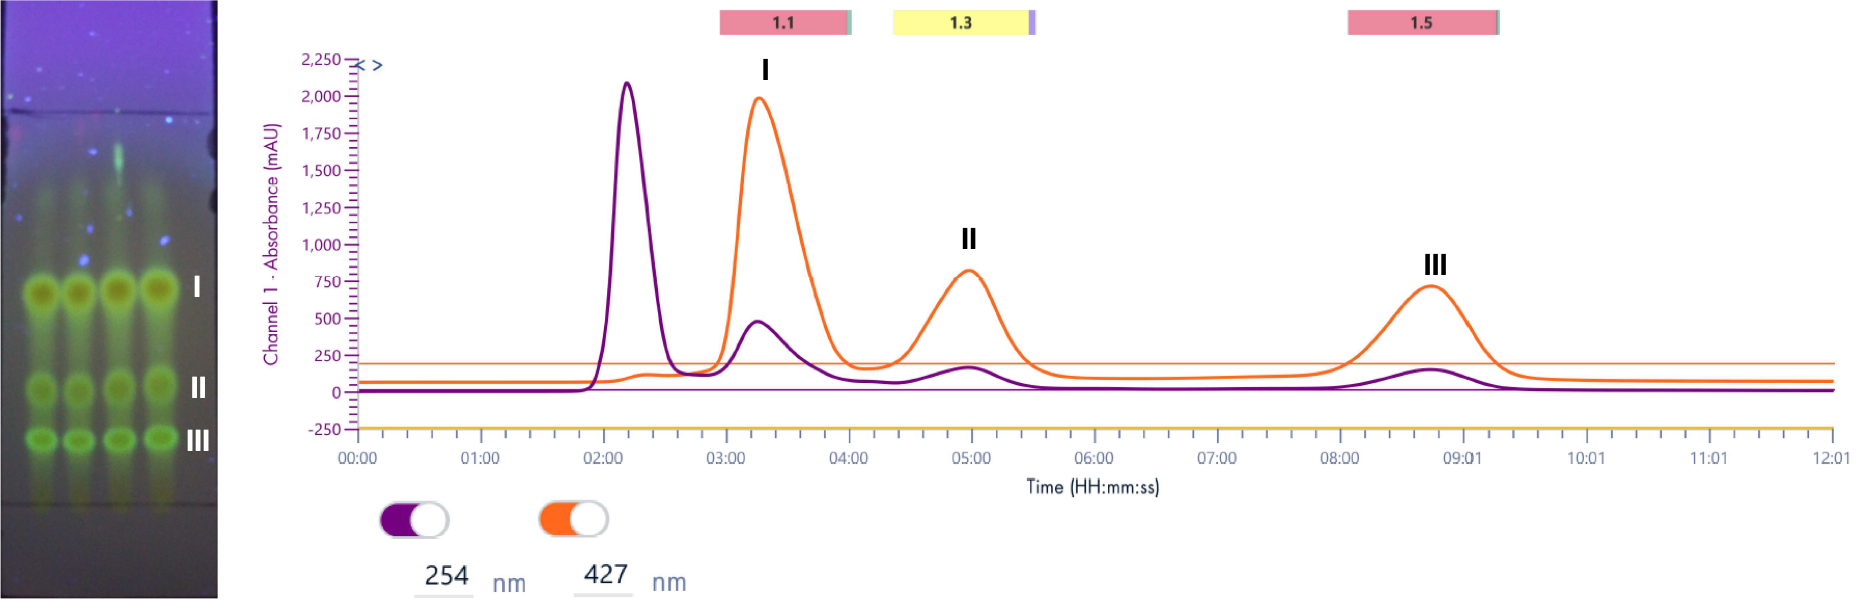
Figure 5: Resulting flash chromatogram from developed TLC Plate.

Fraction Identification by ASAP®/CMS

The expression® CMS with the ASAP® Direct Analysis Probe allows for easy identification of compounds without the need for LC/MS or sample make-up.

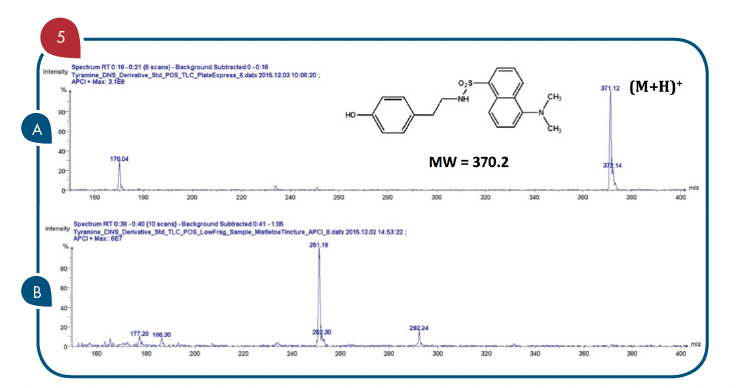
The pure fractions (1.1, 1.3, and 1.5) were analyzed using the ASAP® probe with APCI ionization and positive polarity CMS. The curcuminoids ionize well in both APCI positive and negative polarity, however (M+H)+ ions showed less fragmentation. The detected masses are consistent with the theoretical [M+H]+ m/z values.

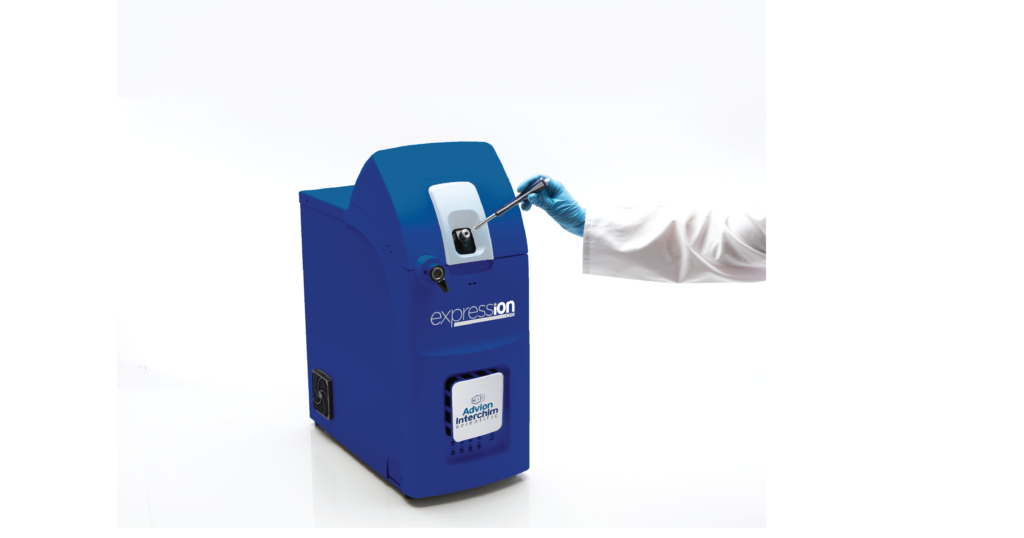
Figure 6: Advion Interchim Scientific ASAP® Direct Analysis Probe being inserted directly into the APCI-enabled ion source of the expression® CMS.

Figure 7: Mass spectra of fractions.

The purified fractions were concentrated to dryness to give solids I (14.1 mg), II (5.6 mg) and III (6.7 mg) respectively, which represents Curcumin (I), demethoxycurcumin (II), and bisdemethoxycurcumin (III) at 53.4%, 21.2%, and 25.3% of the isolated curcuminoid profile. These results are consistent with reported literature values2.

Confirmation of Compound Purity by RP-HPLC

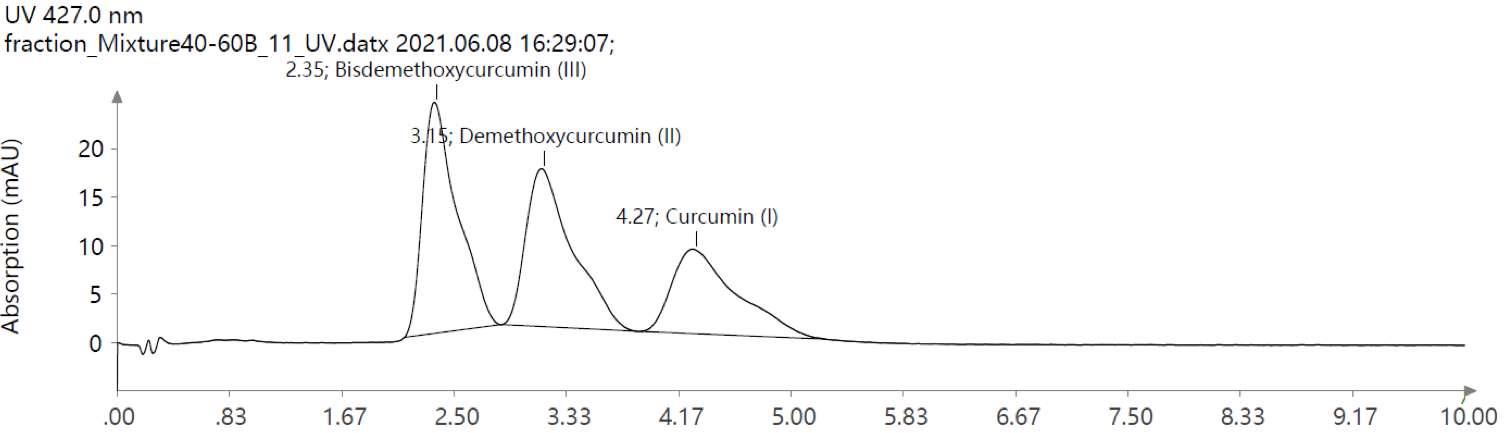
Figure 8: UV Scan of purified fraction mixture.

Reverse Phase High Performance Liquid Chromatography (RP-HPLC) allows for a separate confirmation of compound purity after flash chromatography. An equal mixture of all three compounds was combined and run on a Phenomenex Kinetex® 5 μm Biphenyl 100 Å 50 x 2.1 mm column using isocratic ACN:Water (v:v, 55:45) with 0.2% formic acid. As expected, the elution order of the three curcuminoids changed order with now eluting III, II and I (Figure 8). After developing this method, the respective single collected fraction was injected and analyzed for purity and again confirmed by MS analysis.

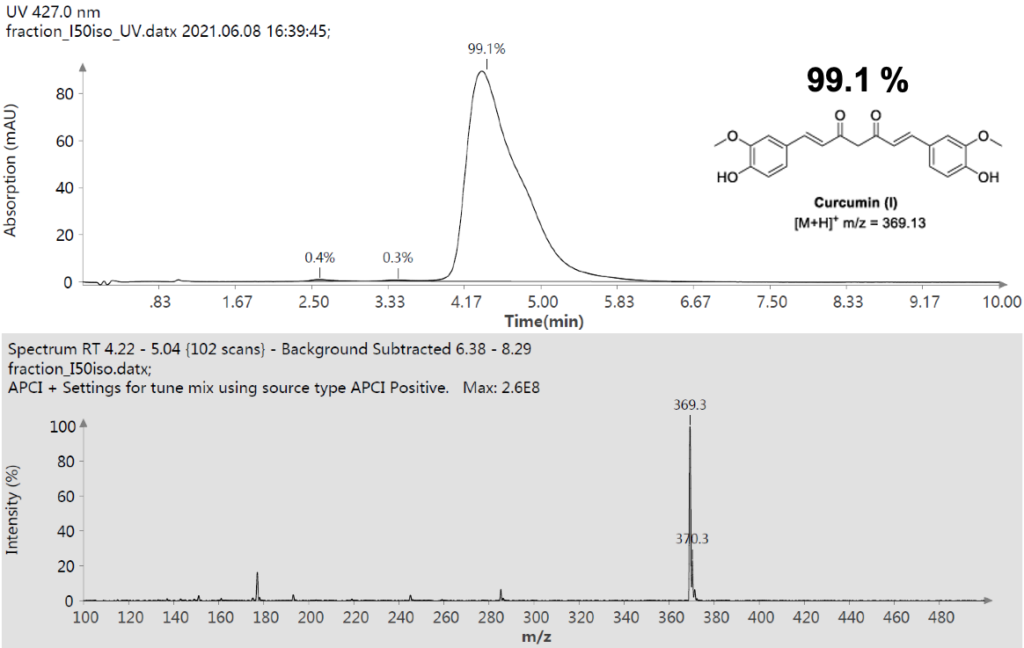
Figure 9: UV Scan and mass spectrum of Curcumin Fraction 1.1.

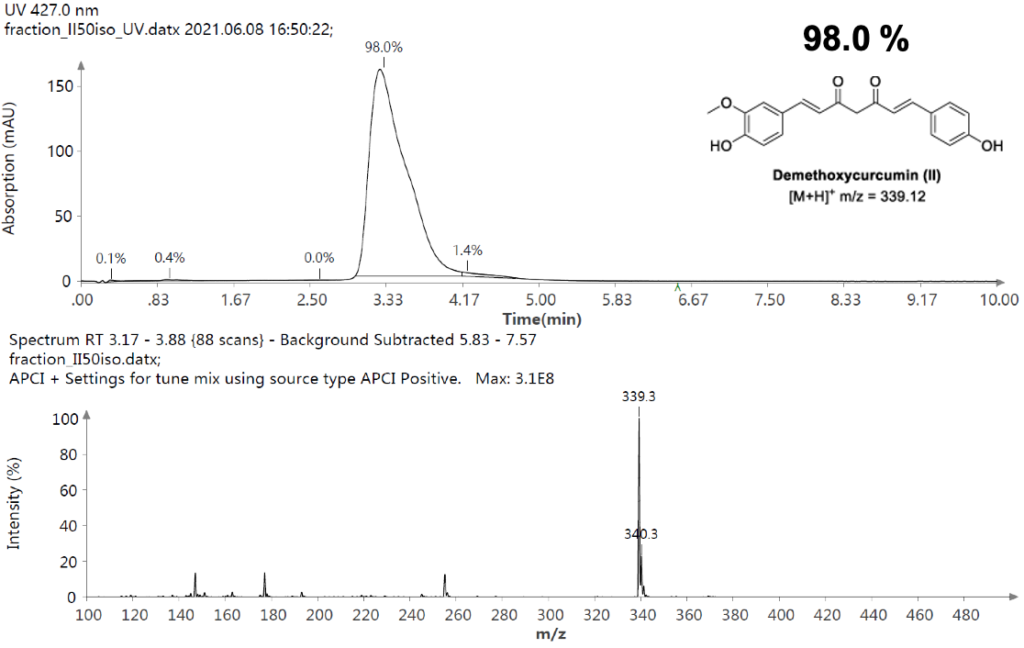
Figure 10: UV Scan and mass spectrum of Curcumin Fraction 1.3.

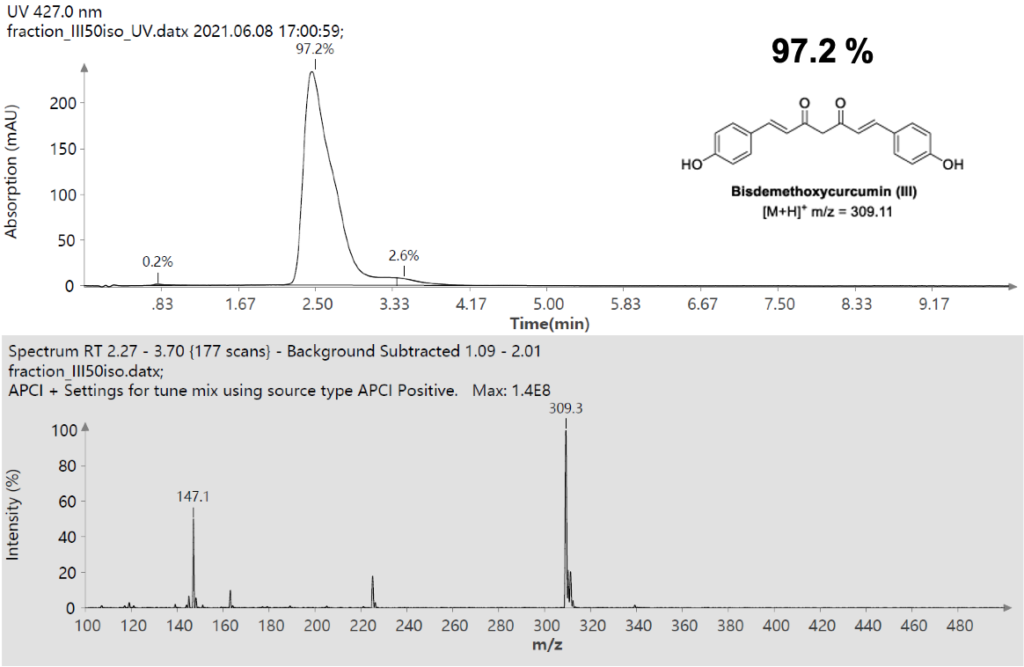
Figure 11: UV Scan and mass spectrum of Curcumin Fraction 1.5.

Conclusion

With a combination of TLC chromatography, flash chromatography and mass spectrometry support at various stages of the process (TLC plate identification, fraction confirmation and secondary purity analysis), we can purify curcuminoids from Turmeric powder at confirmed purity levels of >95%.

References:
1Jayaprakasha et al. Antioxidant activities of curcumin, demethoxycurcumin and bisdemethoxycurcumin. Food Chemistry, Volume 98, Issue 4, 2006, Pages 720-724. ps://doi.org/10.1016/j.foodchem.2005.06.037.
2Praveen et al. Facile NMR approach for profiling curcuminoids present in turmeric, Food Chemistry, Volume 341, Part 2, 2021, 128646, https://doi.org/10.1016/j. foodchem.2020.128646.

Mistletoe: Kiss of Love or Death? Using Thin Layer Chromatography with Compact Mass Spectrometry

Mistletoe

Mass Spec: expression® CMS
Sampling: Plate Express™ 

 In the spirit of the Holiday season and to ensure that mistletoe kisses are enjoyed and are ‘non-toxic’, we employed the Advion Interchim Scientific expression® Compact Mass Spectrometer (CMS) and the Plate Express™ TLC Plate Reader to analyze a commercial Tincture of Mistletoe ethanolic extract to determine whether tyramine is present in the extract of mistletoe. 

INTRODUCTION 

A sprig of mistletoe symbolizes a tradition of romance (Figure 1), and has a legacy of folklore purporting that extracts of mistletoe can cure cancer along with a long list of other reported health benefits. However, mistletoe is also considered lethal. Reputed to be the “kiss of death”, mistletoe is said by some to be so poisonous that humans can be killed if they ingest the leaves or berries. 

Figure 1: The tradition of mistletoe.
Mistletoe

The reported toxicity made us wonder, why or how can vendors sell mistletoe extracts for purposeful human consumption? One species of mistletoe, Viscum, reportedly contains the poisonous alkaloid, tyramine, which can cause blurred vision, nausea, abdominal pain, diarrhea, blood pressure changes, and even death. A search of peer-reviewed scientific literature reveals a dearth of credible analytical support for the presence of tyramine in mistletoe. 

In the spirit of the Holiday season and to ensure that mistletoe kisses are enjoyed and are ‘non-toxic’, we employed the Advion Interchim Scientific TLC/CMS system (Figure 2) to analyze a commercial tincture of Mistletoe ethanolic extract to determine whether tyramine is present in the extract of mistletoe.

Figure 2: Experimental setup of the Advion Interchim Scientific expression® CMS with the Plate Express™ TLC Plate Reader.
CMS and Plate Express
Figure 3: Experimental herbs used.
Mistletoe herb

EXPERIMENTAL 

A tincture of mistletoe was purchased from Indigo Herbs. A small aliquot of this tincture sample was derivatized with dansyl chloride at 50 ºC for 30 min according to well-known procedures[1]. Similarly, an authentic sample of tyramine was derivatized in the same manner to form its dansyl derivative. 

A small aliquot (10 mL) of the standard tyramine dansyl derivative was applied to the outside lanes (Lanes 1 and 4) of a Merck Silica gel G TLC plate. An aliquot of the derivatized tincture of mistletoe was applied to Lane 2 and a derivatized tincture of mistletoe spiked with tyramine dansyl derivative was applied to Lane 3 (Figure 4). 

Figure 4: TLC plate after development and visualization under long wavelength UV light. Lanes 1 and 4: Dansyl derivative of standard tyramine. Lane 2: Dansyl derivative reaction mixture of mistletoe tincture sample. Lane 3: Tincture extract dansyl derivative with standard tyramine dansyl derivative spiked into it. (A) Rf=0.3 for tyramine dansyl derivative. (B) Rf=0.6 for dansyl chloride.
Mistletoe Results

The air-dried TLC plate was developed in an equilibrated solvent tank containing chloroform/ethyl (8/2, v/v) acetate. The developed TLC plate was then viewed under long wavelength UV light to reveal the separated components (Figure 3). The TLC plate was positioned onto the Plate Express™ TLC Plate Reader whereupon each TLC ‘spot’ could be individually analyzed by TLC/CMS. 

With reference to Figure 4, the TLC/CMS analysis readily showed that the Rf 0.3 spots in the two outside lanes (Lanes 1 and 4) produced a mass spectrum with an abundant m/z 371 consistent with the expected protonated molecule of the tyramine dansyl derivative (Figure 5A). The TLC/CMS mass spectra obtained from the spots with an Rf=0.6 observed in Lanes 1 and 4 were consistent with unreacted dansyl chloride with a protonated molecule at m/z 270 (data not shown). TLC/CMS analysis of the spot in lane 2 at Rf=0.3 showed no evidence for the presence of tyramine dansyl derivative (Figure 5B). 

Figure 5: (A) TLC/CMS mass spectrum of standard tyramine dansyl derivative observed at Rf=0.3 in Figure 4 Lane 1. (B) LC/CMS mass spectrum of derivatized tincture of mistletoe observed at Rf=0.3 in Figure 4 Lane 2. 

Mistletoe Spectra

In the absence of TLC/CMS analysis, it would be logical to conclude the spot at Rf=0.3 in lane 2 was due to the presence of tyramine in the mistletoe tincture sample. The Rf=0.3 spot observed for the fortified tincture extract in Lane 3 of Figure 4 readily showed the same mass spectrum for tyramine dansyl derivative that is shown in Figure 5A. The same negative results for tyramine were obtained from the alcohol extract of the mistletoe leaf product. 

CONCLUSIONS 

The results from this brief study suggest either that the level of tyramine in the tincture sample is very low and below our detection limits or that tyramine is not present in the sample. It is common for synthetic and forensic chemists to employ TLC techniques as a quick, easy screen of a sample to determine the presence of an expected chemical. Comparison with a known sample, which shows the same Rf value, will often provide some confidence for reporting the presence of the expected compound. However, as this example suggests a similar Rf value does not guarantee confirmation of the spot identity when it has the same Rf value. As shown here, access to the direct analysis of the spot with the Advion Interchim Scientific expression® CMS can either corroborate the expected identification or, as in this case, suggest that the spot with the same Rf value is NOT the expected compound. These results may explain why the commercial mistletoe tincture samples are not harmful for medicinal purposes. So, what should you do? Mistletoe is not deadly. But it can be hazardous, so don’t eat it. Just ‘steal a kiss under it’! 

REFERENCES AND ACKNOWLEDGEMENT 

[1]Mullins, Donald E. and Eaton, John L. Quantitative high-performance thin-layer chromatography of dansyl derivatives of biogenic amines, Anal. Biochem., 1988, 172, (484-487). 

Thank you to Chief Elf, Nigel Sousou, Ph.D., for leading the sample analysis process.