Soil Analysis using the Advion Interchim Scientific SOLATION® ICP-MS

Introduction

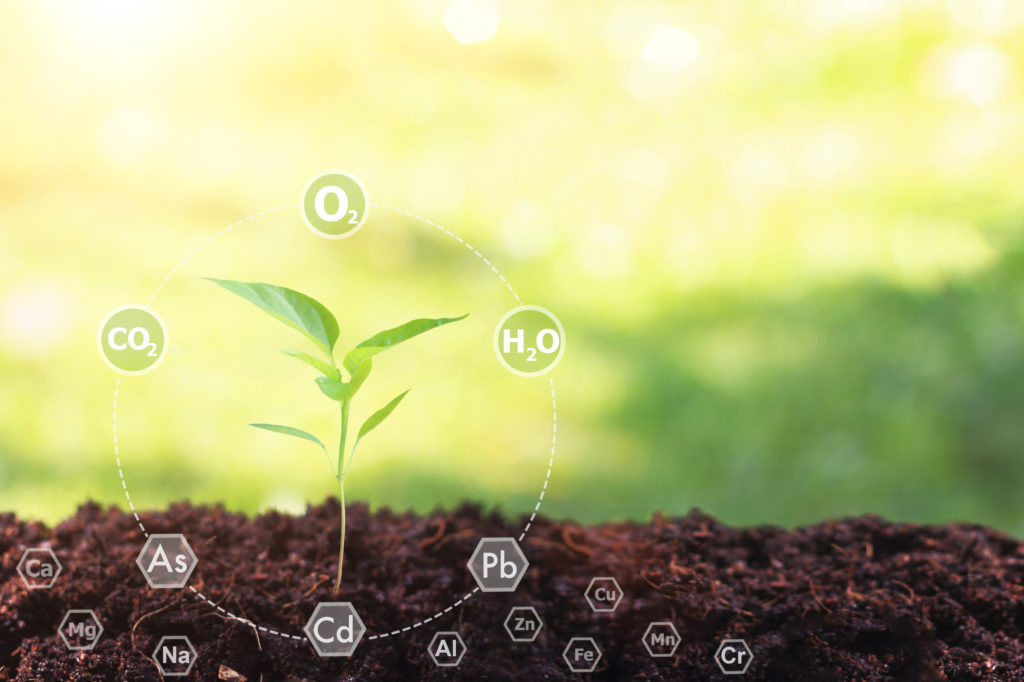
Environmental contaminants generated by human or industrial activities often find their way to the soil via runoff waters or deposition from the air. These contaminants can be taken up by plants and move up the food chain leading to potentially significant impacts on human and animal health. Therefore, it is not only important to monitor the levels of essential nutrients in the soil that are key for healthy plant growth, but it is also imperative that the levels of contaminants are monitored.

In this application note we present a method for routine analysis of 21 elements using the SOLATION® Inductively Coupled Plasma Mass Spectrometer (ICP-MS). A group of unknown soil samples and a CRM were digested using EPA 3051a and analyzed according to method 6020a requirements.

Experiment

Reagents and Materials
• Nitric acid (Aristar Plus, trace metal grade)
• Hydrochloric acid (Aristar Plus, trace metal grade)
• Water, type 1 (18.2 MΩ, Elga point of use system or equivalent)
• NIST CRM2706 “New Jersey Soil, Organics and Trace Elements”
• Spex ‘CL-ICV-1’ multi-element solution
• Aluminum standard solution (1000 μg/ml, Claritas ppt grade)

Instrumentation
1. Anton Paar Multiwave 5000 with the 20SVT50 rotor (20 position, 50mL vessels that vent at 40 bar (580 psi)
2. OKF high speed multi-function grinder
3. Advion Interchim Scientific SOLATION® ICP-MS

Standards

Calibration standards were prepared in the same acid proportions as the digested samples (9mL HNO3+ 3mL HCl, or 3:1). One liter of 3% HNO3+ 1% HCl was made as the diluent for standards, for the final dilution of samples, and to use as a calibration blank.

Standards were made using the Spex multi-element solution ‘CL-ICV-1’ and the single element Aluminum standard. Aluminum was added separately to the mix to account for the high levels of this element in soil.

Samples and Preparation

Four soil samples were dried at 60°C overnight, then finely ground using an OKF high speed multi-function grinder to make a homogeneous mixture. As per EPA method 3051a “Microwave assisted acid digestion of sediments, sludges, and soils”, 0.5 g of each sample were transferred to microwave vessels and mixed with 9mL nitric and 3mL hydrochloric acids. The vessels were then capped and run using the method outlined in Table 1. After digestion the samples were filtered, brought to volume with deionized water in a 50mL volumetric. A 1.0mL aliquot was then diluted to a final volume of 50mL with the prepared diluent for a nominal final dilution of 5,000x depending on the initial sample weight.

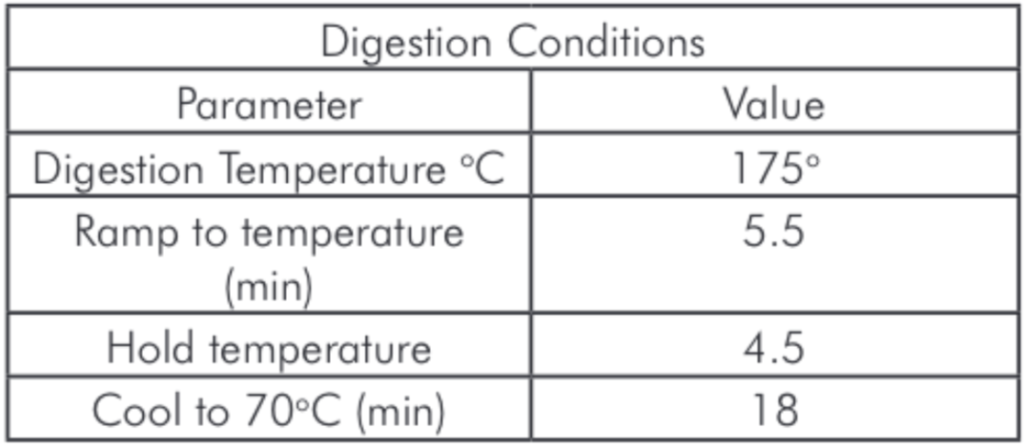
Table 1: Microwave Digestion Program.

For QC purposes the four unknown soil samples were prepared as a sample, duplicate, and spike. They were independently digested where the first two were used to compare the repeatability of the sample preparation, while the third one was spiked prior to the digestion to establish analyte recovery of the digestion procedure.

To verify the accuracy of the results, we included the standard reference material, NIST 2706 “New Jersey soil, organics and trace elements”, which includes certified values for all analytes reported in this study.

The samples were analyzed using a SOLATION® ICP-MS. The SOLATION® instrument configuration for this analysis was a cyclonic spray chamber with a Micromist® concentric nebulizer and a one-piece torch. Ni sampler and skimmer cones were used throughout the study. The plasma operating parameters were:

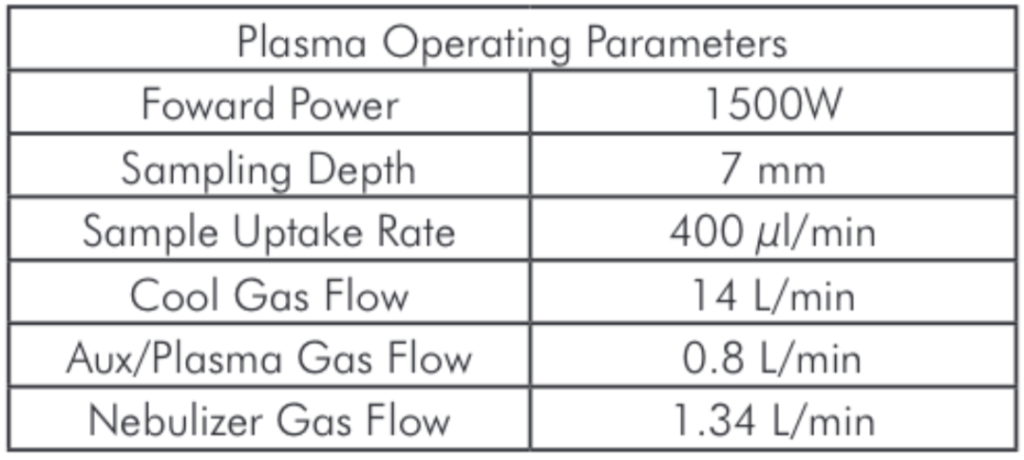
Table 2: Plasma Operating Parameters.

ICP-MS Method

Integral to the SOLATION® ICP-MS is an octupole collision cell that is used for addressing interferences from polyatomic ions, especially for the transition metal elements. It is critical for robust and routine trace element analysis that the octupole cell does not become contaminated which could cause drift and unnecessary downtime. Therefore, the ion path of the SOLATION® ICP-MS was designed to have the collision cell out of the direct line of the plasma. Ions passing through the interface are directed through a 90 ̊ turn and focused onto the entrance of the octupole using a quadrupole deflector (QD). Light and neutral particles continue through the QD and away from the cell.

The collision cell in the SOLATION® ICP-MS can be operated in “He Gas” mode in which the cell is filled with He to act as a collision gas, or in “No Gas” mode in which the cell is empty. The “He Gas” mode is used for isotopes subject to polyatomic interferences while the “No Gas” mode is used for the rest of the isotopes. The rapid switching between “He Gas” and “No Gas” modes on the SOLATION® (< 5 sec) ensures that analytical runs can be kept short, thereby improving productivity.

The helium flow used for “He Gas” mode in this application was 6 ml/min. Table 3 lists the elements used for this analysis and their isotopes, and the mode used for each.

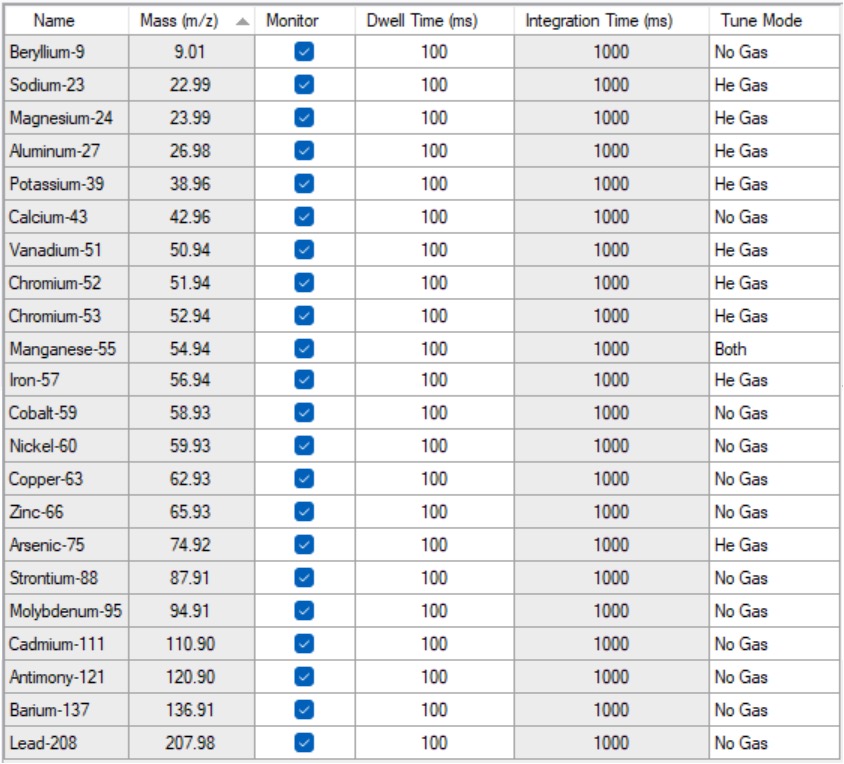
Table 3: A list of the elements included in this study together with their isotopes and the gas mode used for the analysis.

Results and Discussion

The results summarized in Figure 1 show excellent agreement between the measured data for CRM2706 and the reported extracted levels for these elements. A slightly higher recovery was observed for K and Al, possibly due to variability in the extraction efficiency of this digestion method.

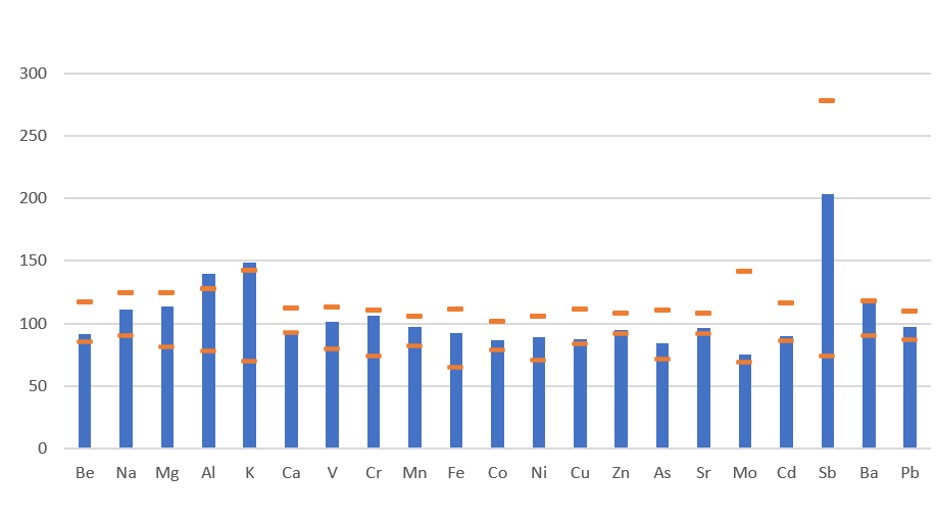
Figure 1: Certified reference material recovery data.

As shown in Table 4 spike recoveries averaged between 75% and 125% for all elements, with the exception of Al; This was likely due to the small size of the spike compared to levels of Al in the samples. Included in the same table are the results from the duplicate digestions/analyses for these elements. On average, the duplicates were less than 20% apart with most elements showing excellent repeatability of <5%.

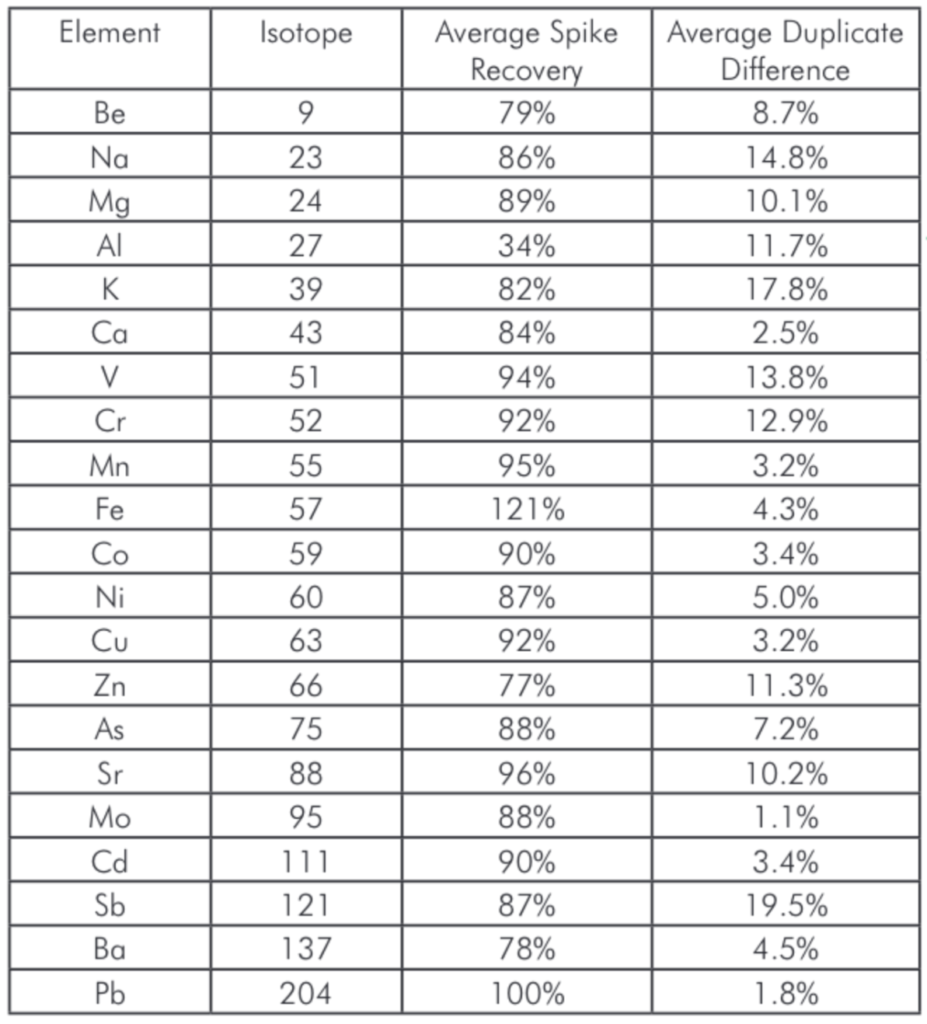
Table 4: Average spike recoveries and duplicate repeatability for the various samples.

Summary

In this application brief we report on the analysis of trace elements in soil using the Advion Interchim Scientific SOLATION® ICP-MS. Excellent recoveries were observed for both spiked samples and CRMs. The combination of the quadrupole deflector and the collision cell minimizes drift and ensures accuracy and precision over time. The reported method benefits from the fast collision cell gas switching capabilities of the SOLATION® to analyze a wide range of elements in soil for rapid, accurate and reproducible results.

Mass Directed Fraction Collection of Natural Products: Examples from Turmeric and Green Tea Extract

Flash: puriFlash® 5.250
Mass Spec: expression® CMS
Sampling: ASAP® probe

Introduction

Flash chromatography has traditionally used UV absorption as the main method of detection for compounds during a purification process. While UV absorption is broadly applicable to many classes of compounds, it has limited specificity to individual compounds in a mixture and misses classes of compounds that do not carry chromophores.

Mass-directed fraction collection gives users the ability to collect fractions based on mass spectrometry detection (MS) which is based on ions specific to individual compounds and provides specific molecular information. This allows for simplification in the overall purification process and greater confidence in the identity of each isolated compound.

Here we describe methods of isolating natural products from green tea and turmeric powder by mass-directed fraction collection during flash chromatography and preparative LC. For demonstration purposes, the isolated compounds were then additionally confirmed by Atmospheric Solids Analysis Probe (ASAP®) MS or HPLC-MS.

Introduction to Curcuminoids

Curcumin is the main curcuminoid found in turmeric root (Curcuma longa). It is commonly used as an ingredient in dietary supplements and cosmetics, flavoring in culinary dishes, and a yellow-orange food coloring. Curcuminoids have been reported as having antioxidant and anti- inflammatory activities.

Store-bought turmeric powder (57.3 g) was extracted in ethanol, then filtered through filter paper, and concentrated. This yielded a crude extract oil of 6.4 g containing the three curcuminoids of interest (also compare TLC analysis in Figure 4).


Figure 1: Structures of the curcuminoids of interest.


Figure 2: Store-bought turmeric powder.


Figure 3: Crude extract oil from turmeric powder.


Figure 4: TLC analysis at 365 nm of turmeric extract (97:3 DCM:MeOH) and the chromatogram of the method transferred to the puriFlash® 5.250 using UV detection.

Method Development

The turmeric extract was first analyzed on a TLC plate and then the method transferred to the puriFlash® 5.250 system using UV detection at two wavelengths. Four compounds were detected at 254 nm with three assumed curcuminoids detected at 427 nm, however, there is no specificity for the individual compounds in UV detection.

An isocratic method (97:3 dichloromethane:methanol) was used as the separation shown on TLC was optimal. The crude material was purified on a 12g, 15 μm spherical silica gel column (PF-15SIHC-F0012). A crude weight of 32 mg was dry-loaded onto 250 mg of silica gel and loaded into a 4g dryload cartridge (PF- DLE-F0004). Fractions were collected using the XIC channels for each compound of interest.


Figure 5: Screenshot of the flash chromatography method run with parameters.

The mass spectrometer settings are controlled through the InterSoft®X software on the puriFlash® system. The mass spectrometer was fitted with an APCI source and run with negative ionization acquisition mode.


Figure 6: Screenshot of the mass spectrometer parameters for chromatography run.

Experiment

Mass-Directed Fraction Collection

The extracted ion chromatogram (XIC) created by plotting the intensity of the observed signal at a chosen mass-to- charge value. This allows for a low-noise signal of compounds of interest. Here the XIC channels are set to detect the three curcuminoids of interest.


Figure 7: TLC Analysis of turmeric extract (97:3 DCM:MeOH) and chromatogram of method transferred to the puriFlash® 5.250 using MS XIC detection.


Figure 8: The mass spectra for each peak as provided by the puriFlash® InterSoft®X software.

ASAP® MS Fraction Confirmation

The pure fractions (1.1, 1.2, and combined 1.3 and 1.4) were additionally analyzed using ASAP® negative polarity MS. The detected masses are consistent with the theoretical [M-H]- m/z values.


Figure 9: The mass spectra of the isolated compounds confirming their identity and purity.

Introduction, Green Tea Catechins

Dry green tea typically consists of 10-30% of polyphenols based on dry weight with catechins being the major tea polyphenols including: (−)-epigallocatechin (EGC), (−)-epigallocatechin-3-gallate (EGCG), (−)-epicatechin- 3-gallate (ECG) and (−)-gallocatechin gallate (GCG). EGCG is the most abundant and biologically active catechin, separating and purifying catechins from raw tea extract can greatly increase their market availability and value.

Dry green tea leaves were extracted into hot water, then partitioned with ethyl acetate, filtered through filter paper, and evaporated to give a crude extract. The dry extract was then dissolved in 7.5 mL of water and filtered with 0.2 μm filter before further processing.


Figure 10: Green tea leaves steeping.


Figure 11: Major Catechins in Green Tea.

Method Development
With HPLC-UV/MS analysis, EGC, EGCG, GCG, EC and ECG are detected in the tea extract (Figure 12).

Solvent A: Water
Solvent B: Methanol
UV: 275 nm
MS: full scan from 150-900
Column: US15C18HP-250/046


Figure 12: The HPLC-UV chromatogram of green tea extract, MS data and a standard for EGCG was used for compound confirmation (data not shown).

The mass spectrometer settings are controlled through the InterSoft®X software on the puriFlash® system. The mass spectrometer was fitted with an ESI source and run with negative ionization acquisition mode.


Figure 13: Screenshot of the mass spectrometer parameters for chromatography run.

Mass-Directed Fraction Collection
Here the XIC channels are set to detect the 4 catechins of interest. EGCG and CGC are isomers and therefore share the same mass.


Figure 14: Chromatogram of the method transferred to the puriFlash® 5.250 using MS XIC detection.


Figure 15: The mass spectra for each peak as provided by the InterSoft®X software.

Conclusion

• With natural products isolation, one of the biggest challenges is the identification of compounds of interest in complex extract mixtures.
• Using MS and chromatography in tandem we can separate and identify compounds in a complex mixture with a high degree of purity and accuracy without the need for further identification of fractions collected.
• The fractions collected can be characterized directly through the MS data provided by the InterSoft®X software on the puriFlash® systems.
• The puriFlash® 5.250 and expression® CMS make a powerful duo in the purification and identification of natural products such as the catechins found in green tea and the curcuminoids found in turmeric.

Helium Shortages in the Chemistry Lab: Compound Characterization Using Helium-Free Techniques

Helium shortages are not new – annually, scientists see the cost of helium rise and fall like the stock market. Except this isn’t just a financial impact. Global helium shortages threaten to derail research and essential industry functions, taking down GC and high-field NMR instruments, bringing a once state-of-the-art lab down to a bare-bones facility.

This whitepaper explores the use of alternative reaction monitoring technology, including the expression® CMS (Compact Mass Spectrometer), Plate ExpressTM TLC Plate Reader, and ASAP® probe for liquid and solid samples – all helium-free alternatives for the chemistry laboratory.

Reaction Monitoring Capabilities at the Bench:

The expression® CMS offers an ideal reaction monitoring solution that will live on long beyond the helium shortage and become a centerpiece of the lab. The system offers a complete solution for: 

  • Batch and flow chemistry 
  • Fast compound identification and purity determination
  • …with little or no sample preparation required, and many novel sample introduction interfaces