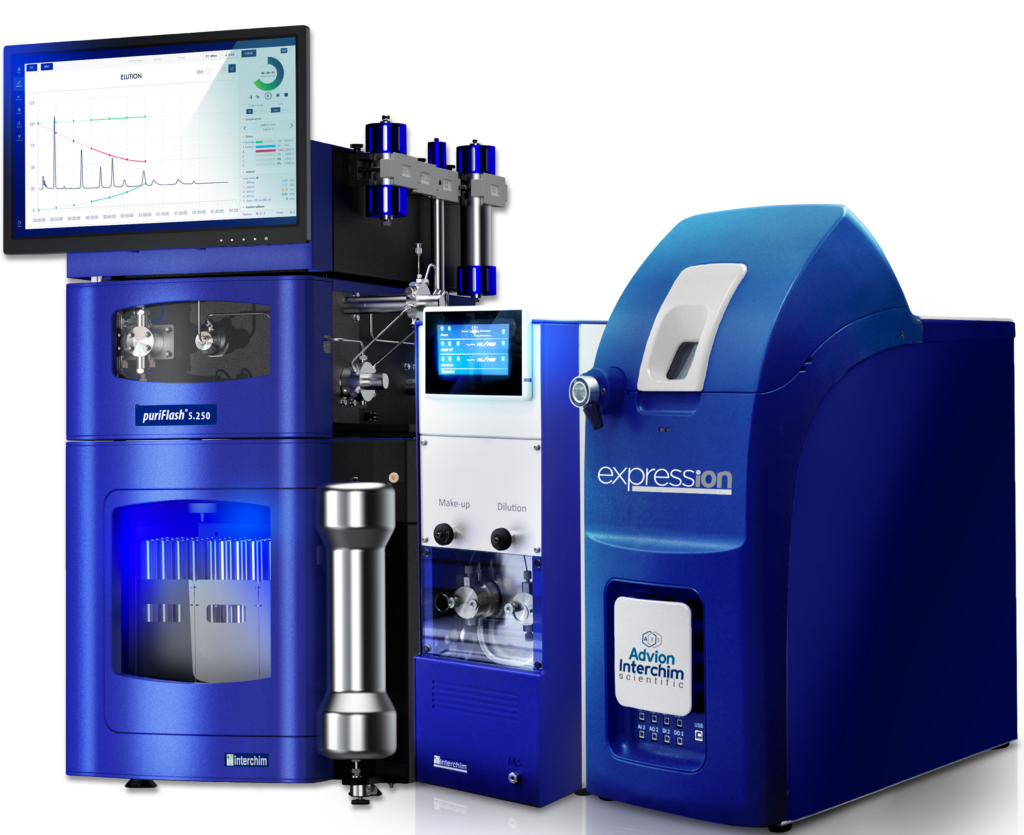
Instrumentation
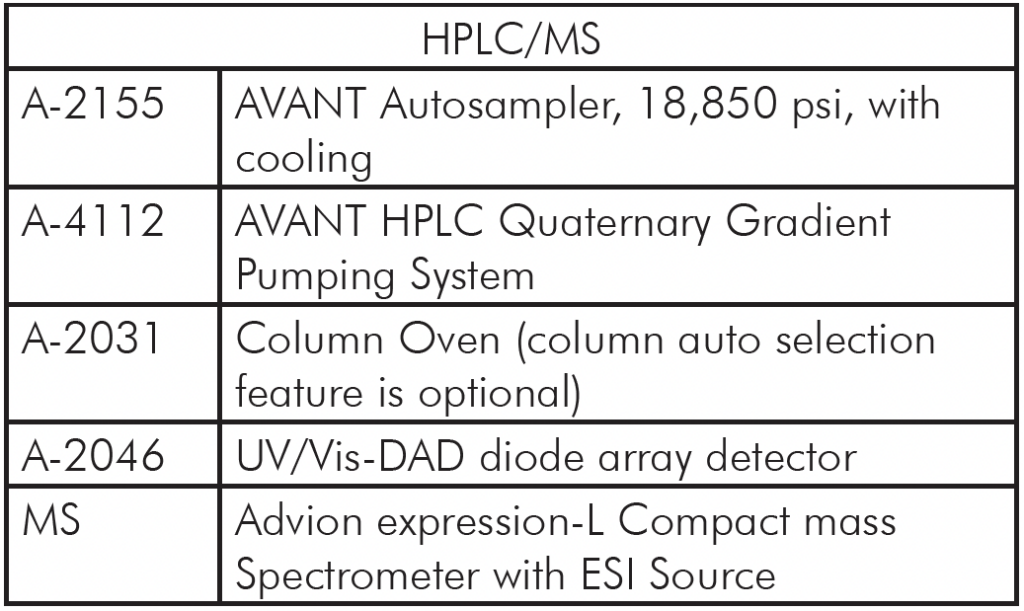
Mass Spec: expression® Compact Mass Spectrometer (CMS)
HPLC: AVANT®
Introduction
Oligonucleotides have gained significant attention in biopharmaceutical development due to their
ability to modulate gene or protein expression. Their clinical success is evident with the approval of several oligonucleotide-based drugs or their advancement into clinical trials.[1] These drugs include antisense oligonucleotides, small interfering RNA (siRNA) therapeutics, and mRNA-based vaccines, exemplified by the successful development of COVID-19 vaccines. Such accomplishments have spurred further interest and investment in oligonucleotide research and development.
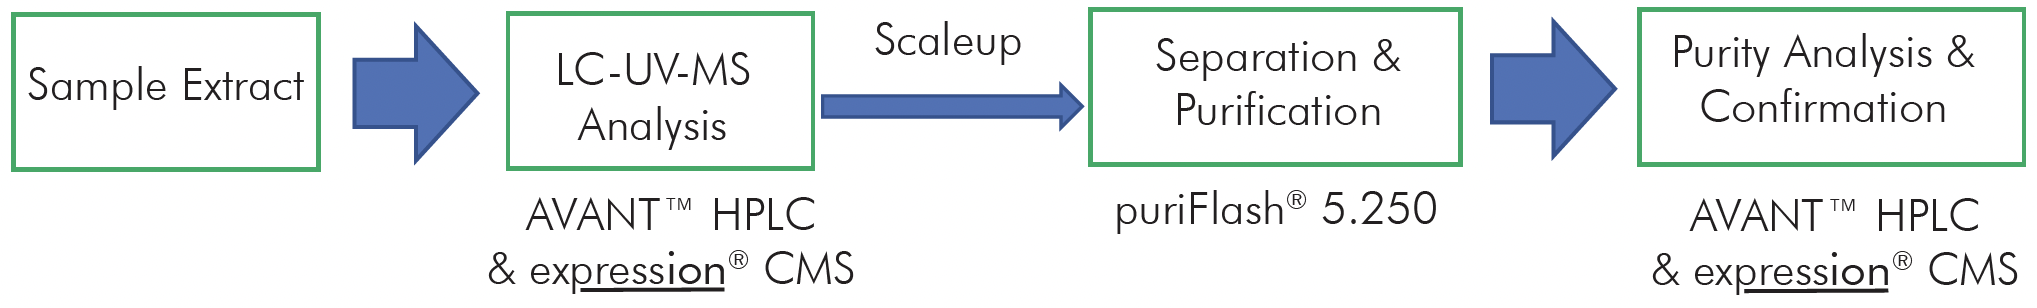
Solid-phase synthesis is a commonly used method to produce oligonucleotide sequences. The raw material is typically purified through various techniques, such as desalting, ultrafiltration, solid-phase extraction (SPE), high-performance liquid chromatography (HPLC), or preparative liquid chromatography (prepLC), depending on the desired purity level. Ion-pairing HPLC or prepLC methods are often preferred as they offer higher purity compared to other techniques.
This application note aims to demonstrate the HPLC/UV analysis of multiple oligo samples and utilize HPLC/CMS analysis to determine their molecular weight.
Method
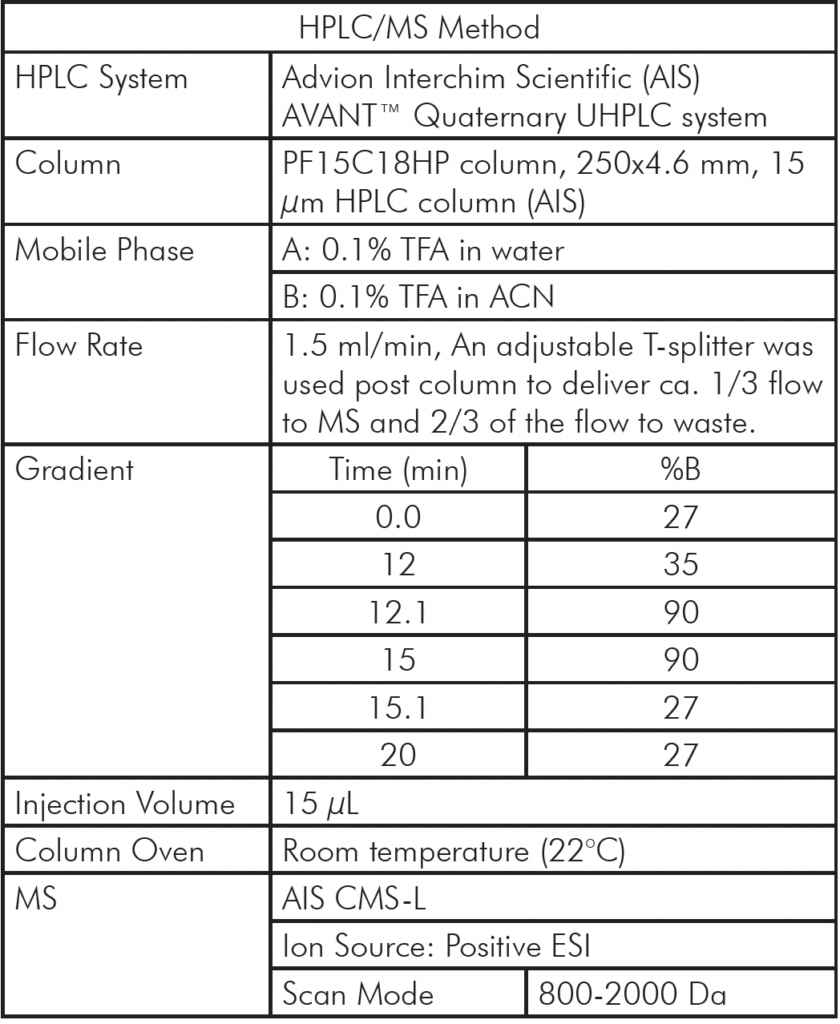
HPLC-UV/CMS System
With a quaternary pump and column selection valve, the process of switching between different buffers and columns for various analyses becomes remarkably straightforward, eliminating the need for manually
removing the column and changing the solvent. This automation greatly enhances efficiency and convenience in the analytical process.
Oligo(dT) 12-18 primer
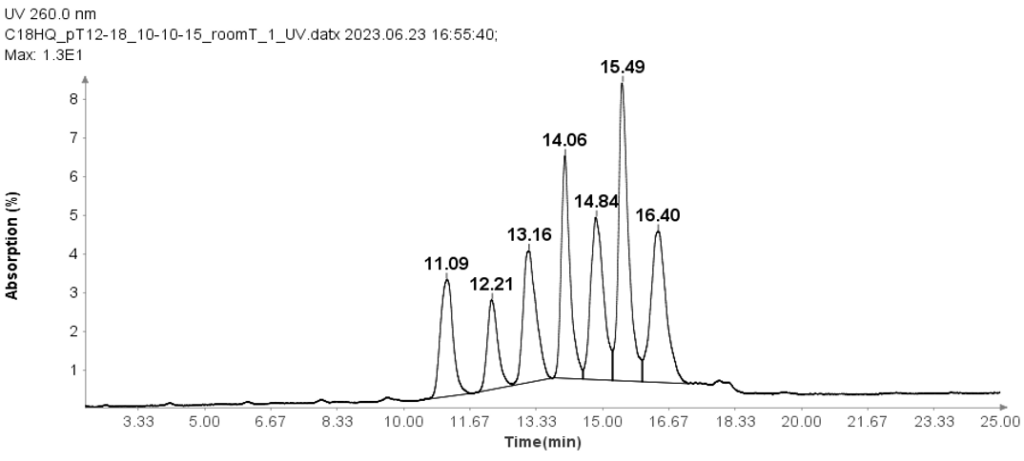
Oligo(dT) 12-18 primer (Thermos Fisher Scientific, MA) was used to check the HPLC method for oligonucleotides analysis.
The separation of these Oligo(dT) 12-18 primer was carried out using an ion-pair reverse phase HPLC method with an Interchim Uptisphere Strategy 5 μm C18HQ column 250 x 4.6 mm. A 10 μL aliquot was injected for all analyses, and the column temperature was maintained at 30°C. The mobile phase A composition was 100 mM TEAA in water, while mobile phase B is acetonitrile. And the flow rate is 1 ml/min.
The HPLC analysis proceeded as follows: After injection of the sample, mobile phase B was set at 10% for 1 minute. It was then linearly increased to 15% over 24 minutes. At 25.1 minutes, it increased to 95% and kept at this level for 2.4 minutes to clean the column. Subsequently, at 27.6 minutes, it reduced to 10% and maintained for 2.4 minutes for column equilibration.
Figure 1 illustrates that the HPLC method effectively separates the seven Oligo(dT) 12 to 18 primers.
RNA Standard with 4 components
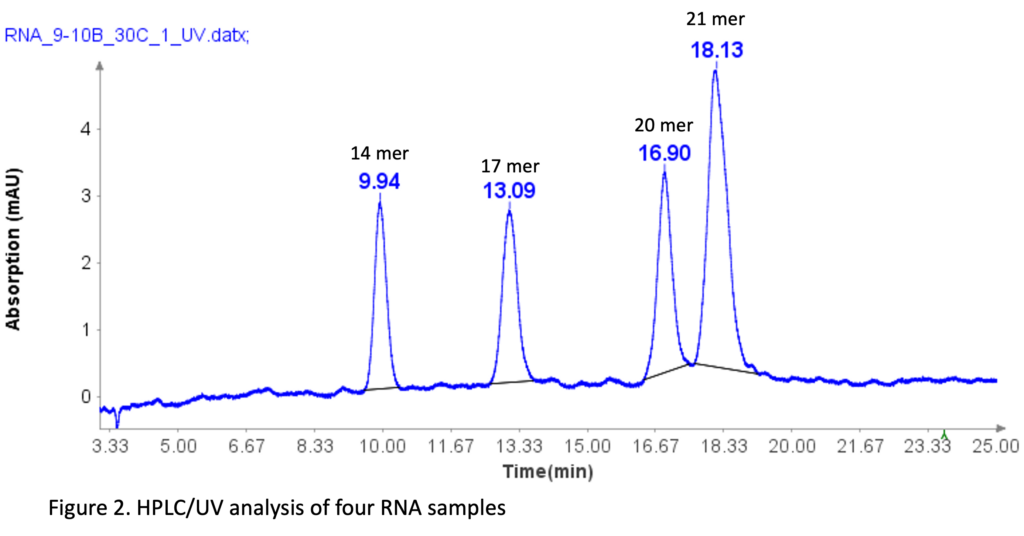
The RNA oligonucleotides mixture (Aglient Technologies, CA ) was prepared by diluting it 10 times with DI water before HPLC analysis. The sequences of four RNA standards are as follows: 14 mer (CACUGAAUACCAAU), 17 mer (UCACACUGAAUACCAAU), 20 mer (UCAUCACACUGAAUACCAAU), and 21 mer (GUCUCAUCACACUGAAUACCAAU).
The separation of these RNA samples was conducted using a similar HPLC method as that for oligo(dT)12-18 primers, with slight modifications.
The HPLC analysis proceeded as follows: After injection of the sample, mobile phase B was set at 9% for 1 minute. It was then linearly increased to 10% over 24 minutes. At 25.1 minutes, it increased to 95% and kept at this level for 2.4 minutes to clean the column. Subsequently, at 27.6 minutes, it reduced to 9% and maintained for 2.4 minutes for column equilibration.
Figure 2 illustrates that the HPLC method effectively separates the four RNA samples, even with a 1-mer difference between the 20-mer and 21-mer RNA samples. This baseline separation for the 20-mer and 21-mer is crucial for analyzing synthetic oligonucleotides, as most impurities during synthesis are typically N=1 mer or N+1 mer.[2]
ssDNA Samples
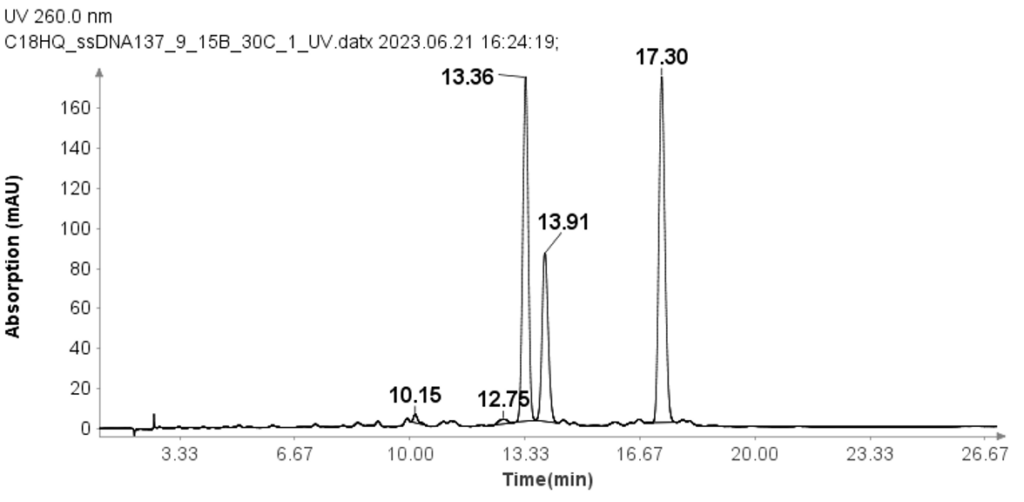
Three single-strand DNA samples (ssDNA) with 17 mer (GTCAGCAAGGACATCGT), 18 mer(CATTTGAGTAGCCAACGC), and 19 mer (GGACACTTTCATGCGAGTT) were also tested using the modified HPLC method from that used for RNA samples.
The concentration of each ssDNA was 30 μM, and 10 μL aliquots were loaded onto the column for analysis. The HPLC analysis was performed using the following gradient: After the sample injection, mobile phase B (MPB) was set at 9% for 1 minute, then linearly increased to 15% over 24 minutes. At 25.1 minutes, it increased to 95% and maintained at this level for 2.4 minutes to clean the column. At 27.6 minutes, the MPB was reduced to 9%, and this level was maintained for 2.4 minutes for column equilibration. The flow rate for the analysis was set to 1.5 ml/min. Despite the greater change in solvent B per minute compared to the RNA samples, Figure 3 demonstrates that the method effectively separates the three ssDNA samples with good baseline resolution.
Purity Analysis of a ssDNA Sample
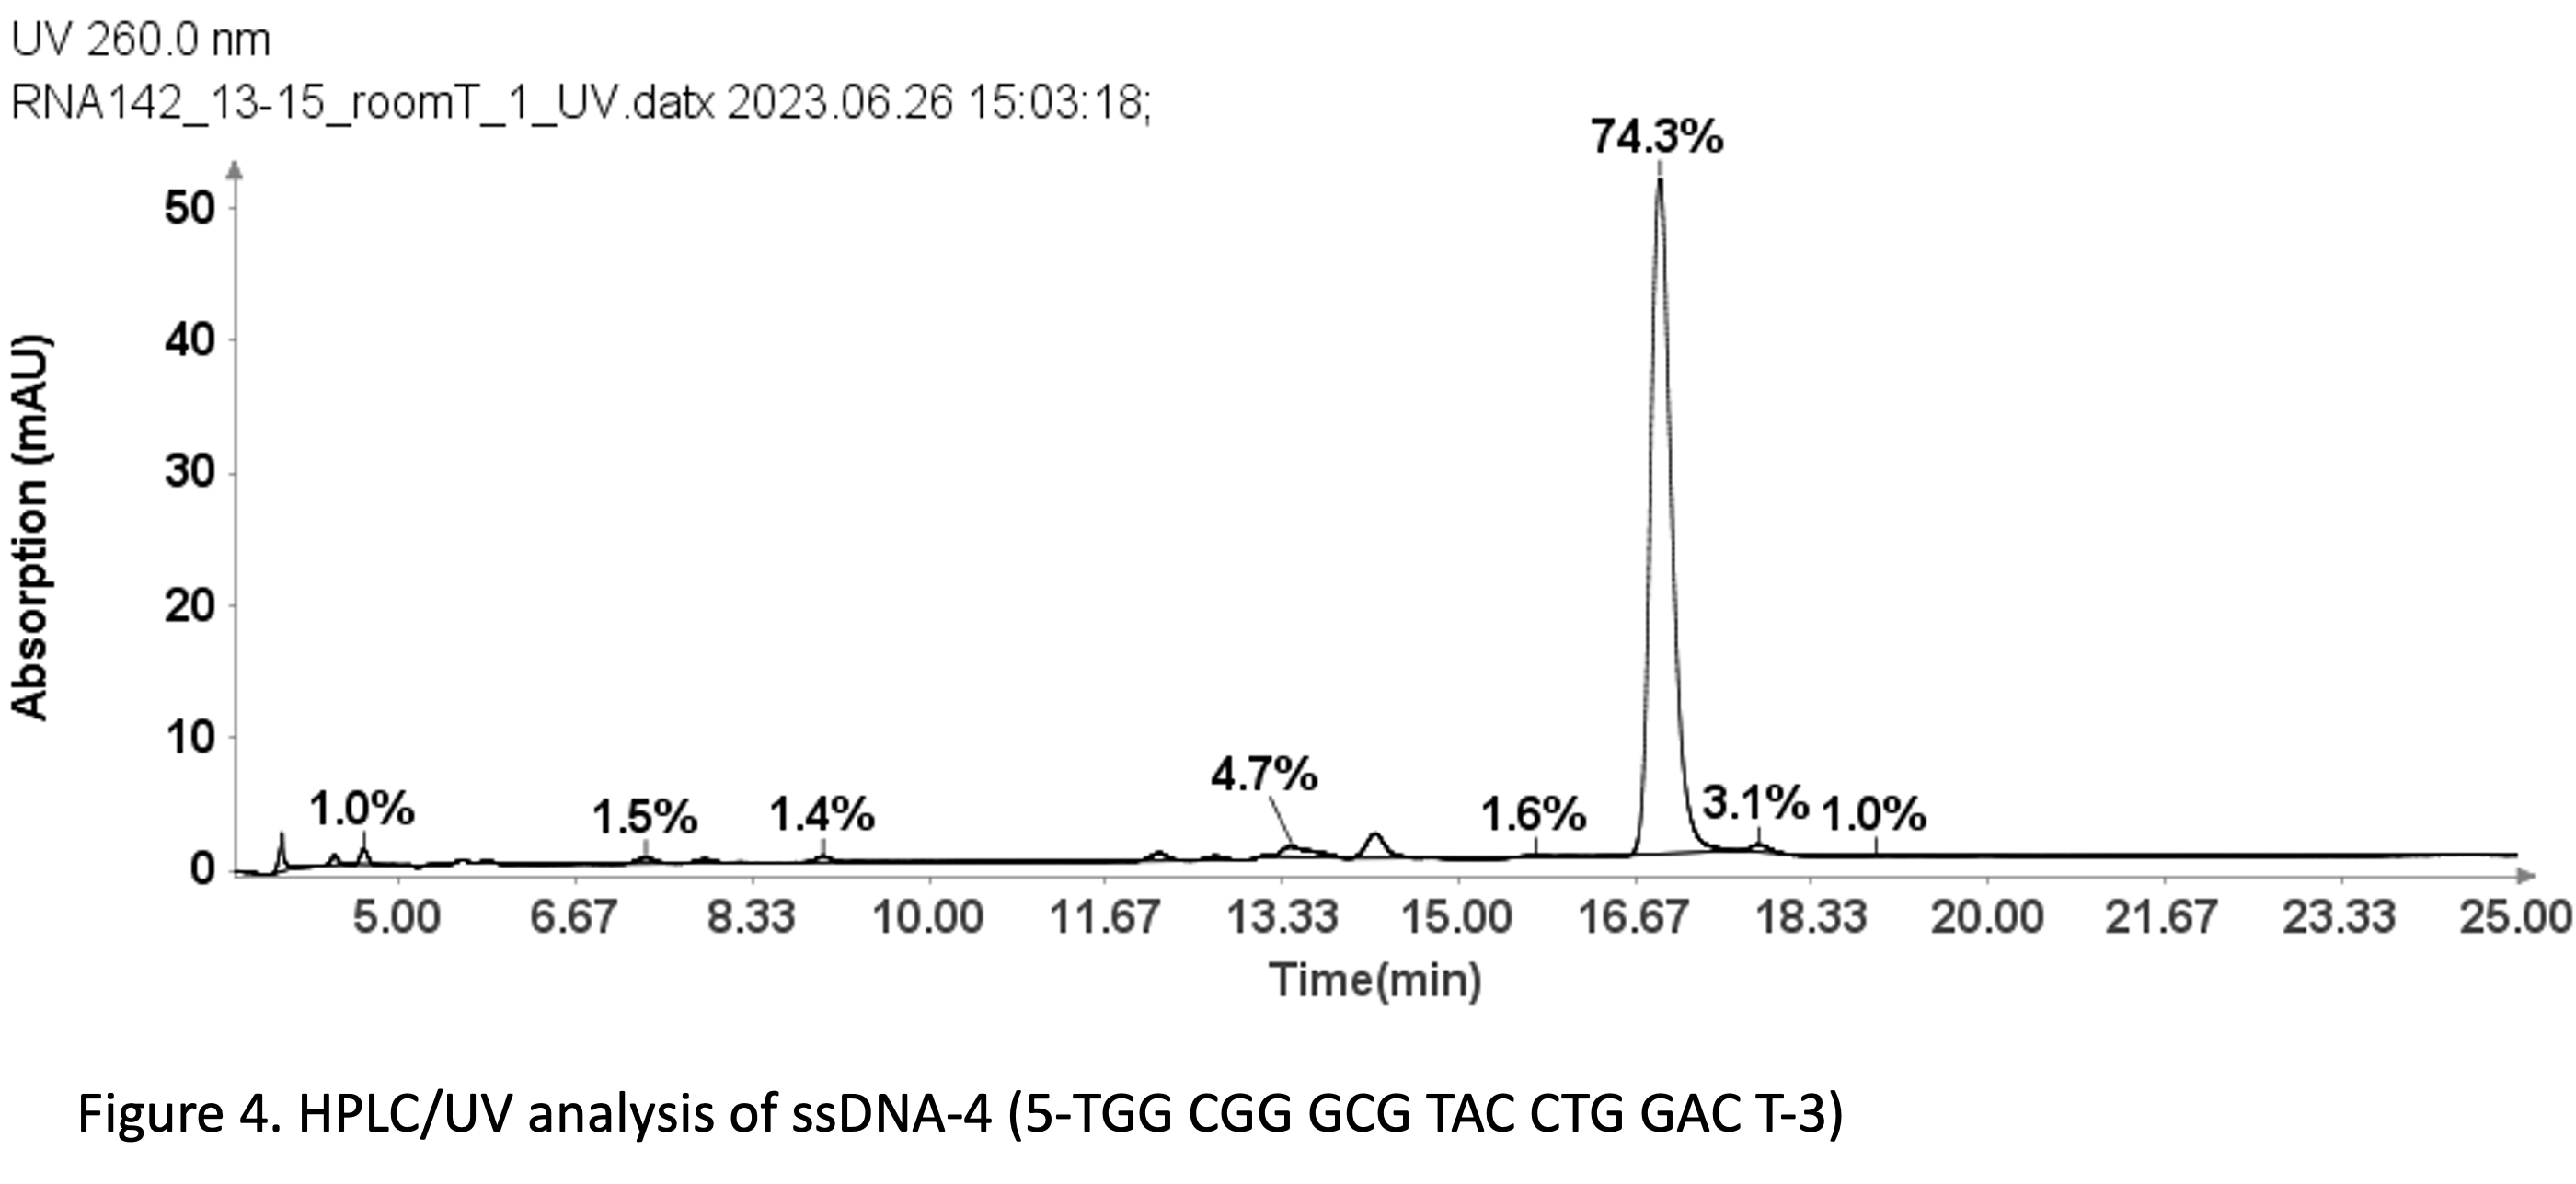
With a same method used for ssDNA samples shown in figure 3, it was also employed for the purity analysis of an ssDNA sample: 19 mer (5’-TGGCGGGCGTACCTGGACT-3’).
Figure 4 reveals that the 19-mer ssDNA 4 has a UV purity of 74.3% at 260 nm that was determined using Advion Data Express software.
MS Analysis of ssDNA sample used in F.5 purity analysis
The HPLC/MS analysis of oligonucleotides was performed using an Advion AVANT® HPLC system coupled with an Advion Expression® CMS-L. For MS analysis, the Interchim Uptisphere Strategy 2.6 μm C18-HQ column with dimensions 50 x 2.1 mm was used, with a flow rate of 0.2 ml/min. The column temperature was set to 55°C.
Compared to the use of TEAA for the mass analysis of oligonucleotides, the ion pair reagents combining TEA and HFIP offer significantly improved performance. Therefore, this application note will focus on employing TEA and HFIP ion pair reagents for the HPLC/MS analysis of oligonucleotides.
The mobile phase consisted of 15 mM TEA and 10 mM HFIP in water as mobile phase A, and methanol as mobile phase B. The total HPLC run time was 25 minutes, starting with 5% of solvent B for 1 minute.
The percentage of B was then increased to 6% over 14 minutes, followed by an increase to 95% at 15.1 minutes that was kept for 2.9 minutes to elute the compounds of interest. Subsequently, the % B was reduced to 5% and kept at this level for 6.9 minutes to equilibrate the column before the next analysis.
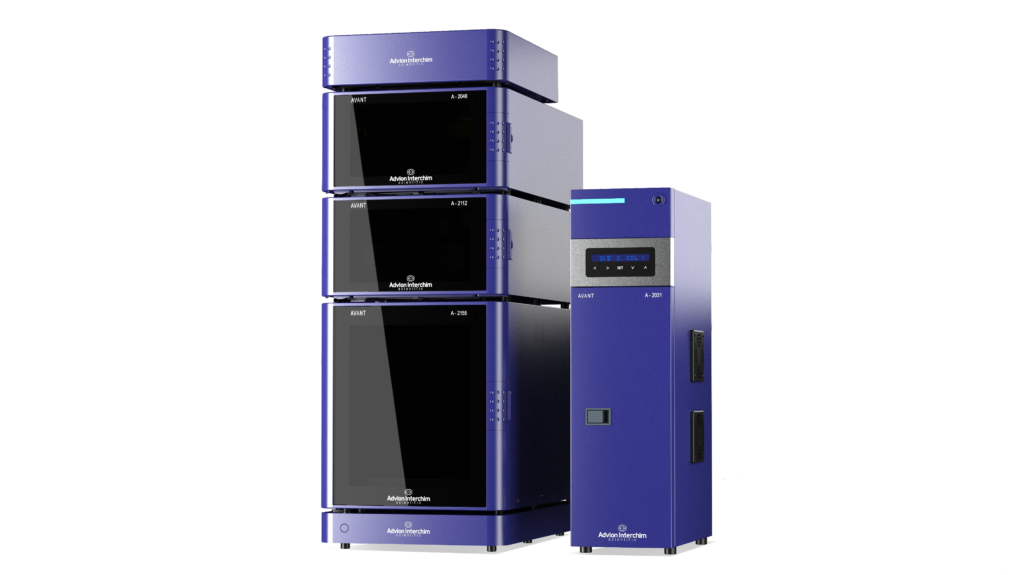
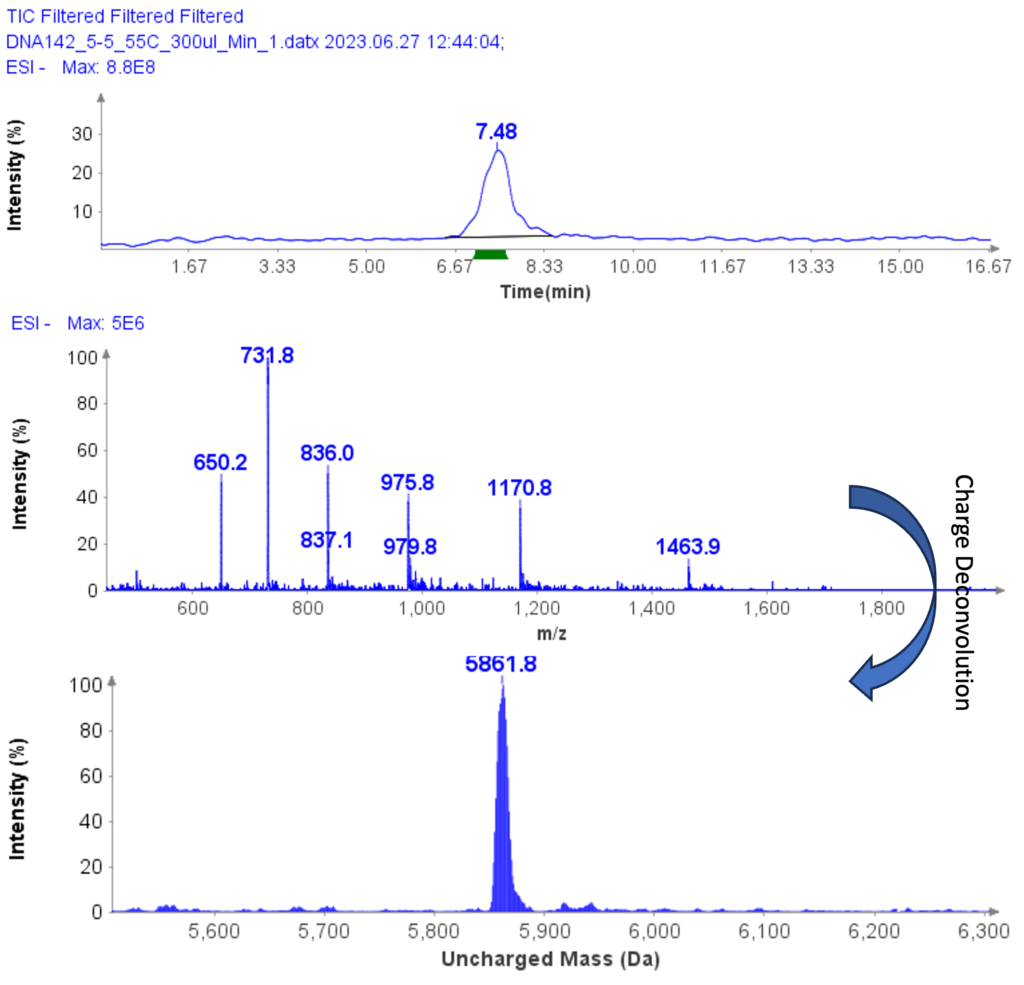
The MS analysis was conducted in negative ESI mode with the MS scan range set from 500 to 2000 Da. Figure 5b shows the MS spectra of ssDNA-4, displaying a charged envelope with peaks at m/z 1463.9 (4-), 1170.8 (5-), (975.8 (6-), 936.0 (7-), 731.8 (8-), and 650.2 (9-). Through charge deconvolution in Data Express, the uncharged mass for the ssDNA sample was determined to be 5861.8 Da, which closely matches the theoretical value of 5860.8 Da.
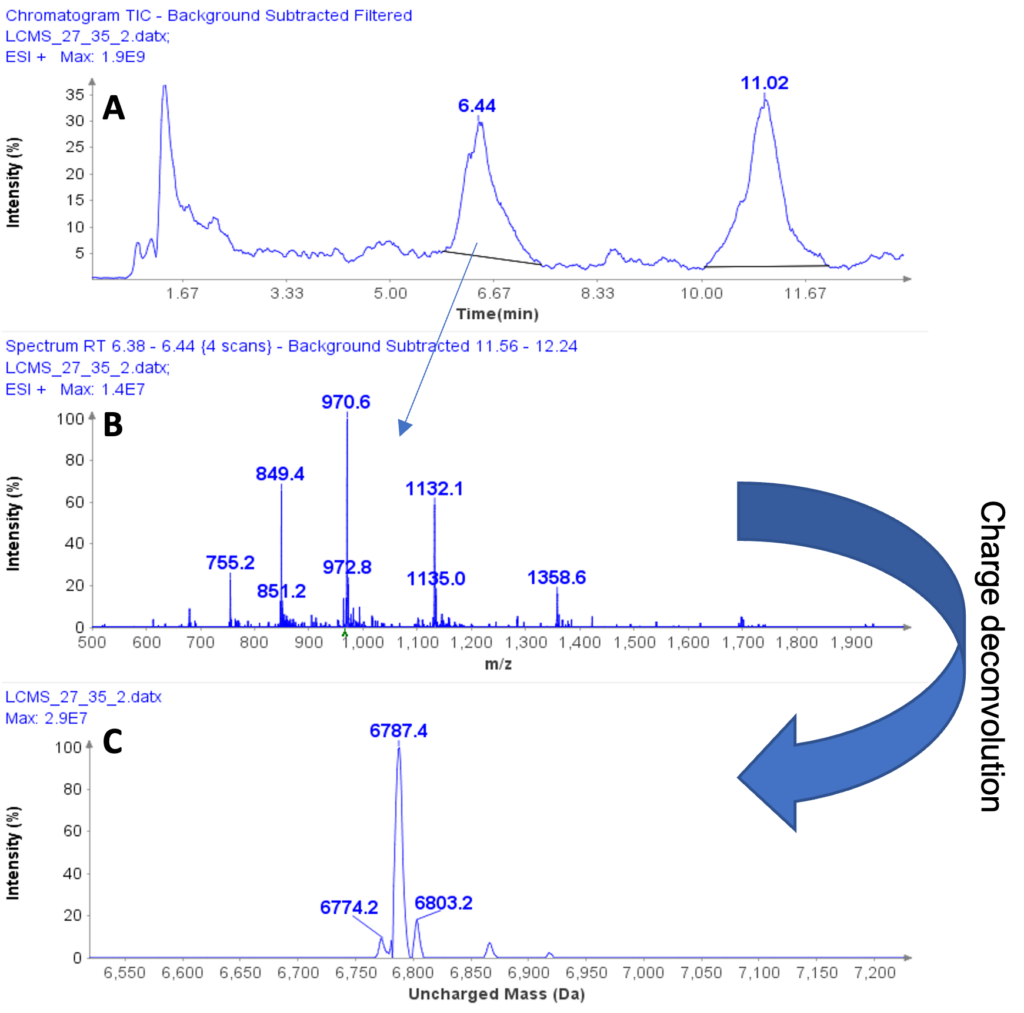
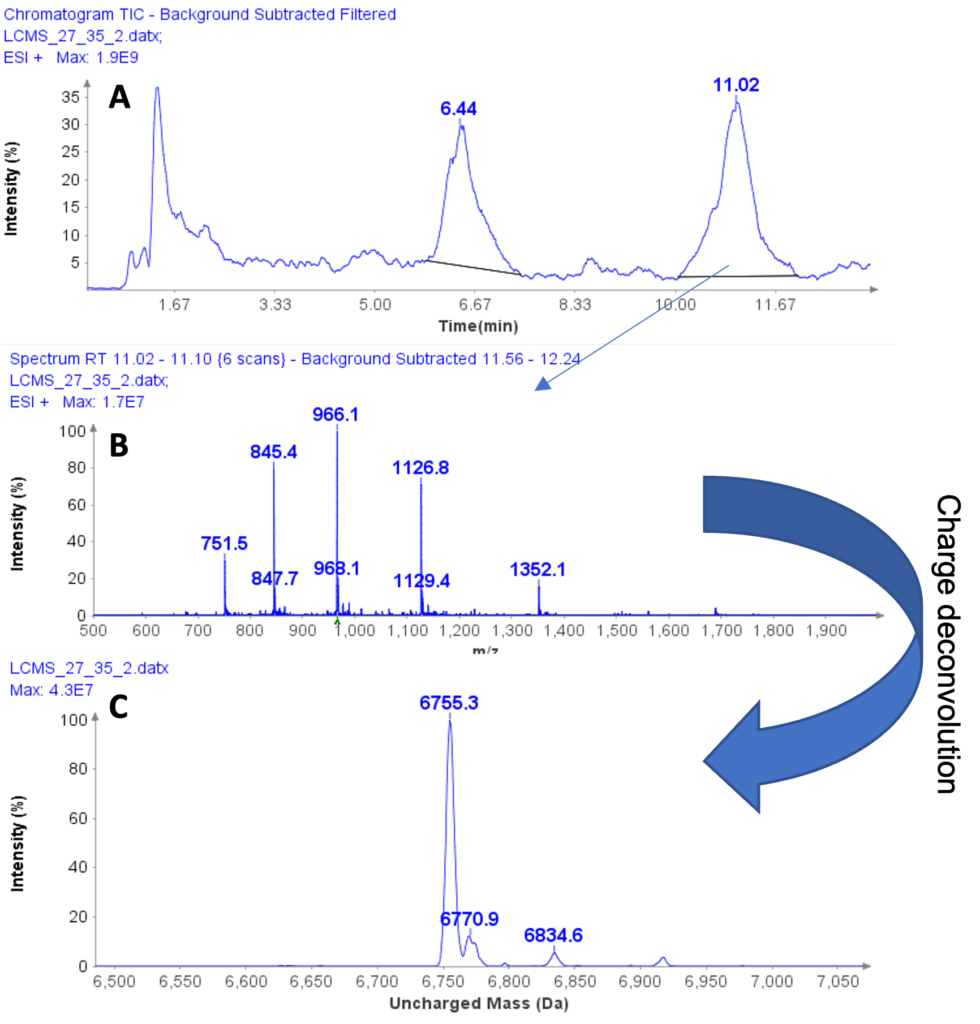
MS Analysis of a Further Example Sample
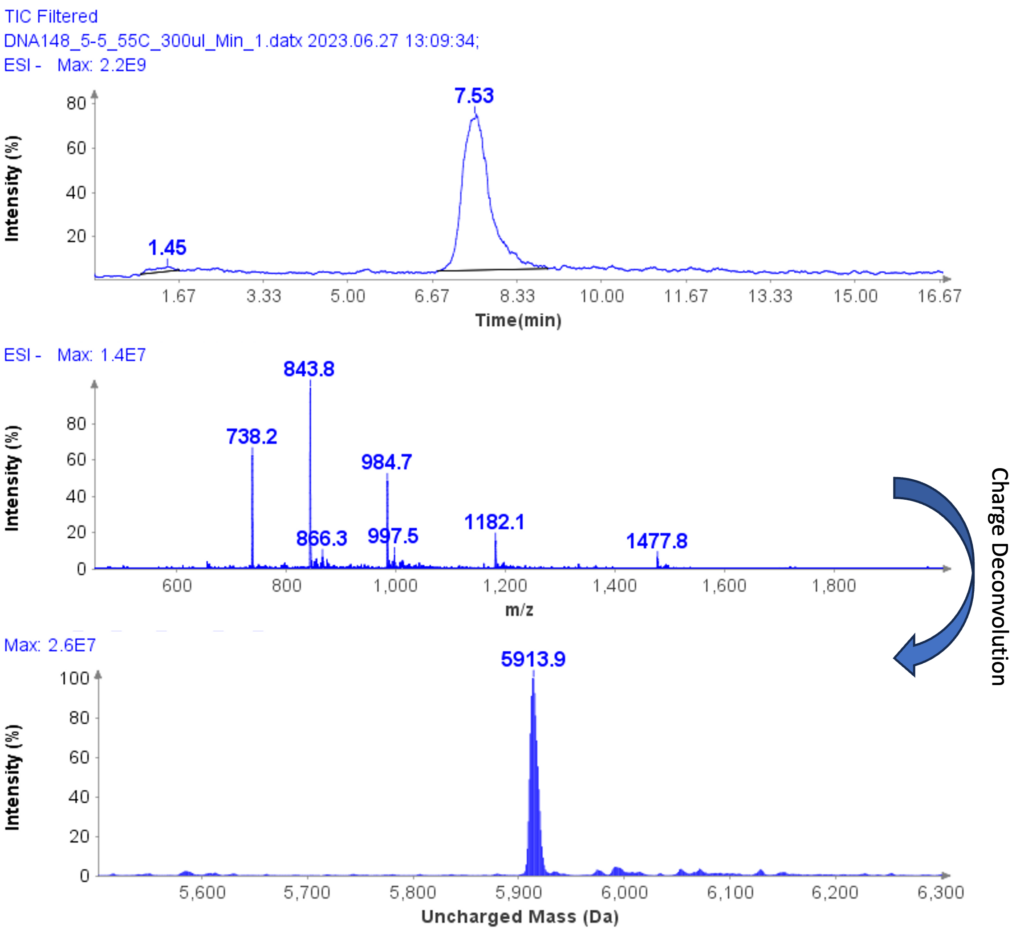
The MS spectra of ssDNA-5 (5’-GGG-TGG-CAT-TATGCT-GAG-T-3’) are depicted in Figure 6, showing a charged envelope with peaks at m/z 1477.8(4-), 1182.1(5-), 984.7(6-), 843.8(7-), and 738.2(8-). By charge deconvolution the uncharged mass for the ssDNA-5 was determined to be 5913.9, which is in close agreement with the theoretical value of 5914.9.
Conclusion
Using a 5 μm particle size C18HQ column coupled with TEAA (Triethylammonium acetate) ion-pairing reagent has been demonstrated to be suitable solution for oligonucleotide HPLC analysis.
For MS analysis of Oligonucleotides, the same C18HQ column can be employed with HFIP (hexafluoroisopropanol) and TEA (triethylamine) as the ion-pairing reagent in conjunction with an AVANT® HPLC-UV/CMS system. This method has been proven to yield additional accurate mass measurements of Oligonucleotides.
Overall, utilizing the Interchim C18HQ column and the appropriate ion-pairing reagent in combination with the AVANT® HPLC-UV and -CMS system can provide a reliable solution for the purity analysis and characterization of oligonucleotides.
References
[1]Roberts, T.C., Langer, R. & Wood, M.J.A. Advances in oligonucleotide drug delivery. Nat Rev Drug Discov 2020, 19, 673–694
[2]Martina C. et.al. Oligonucleotides: Current Trends and Innovative Applications in the Synthesis, Characterization, and Purification, Biotechnology J. 2020, 1900226