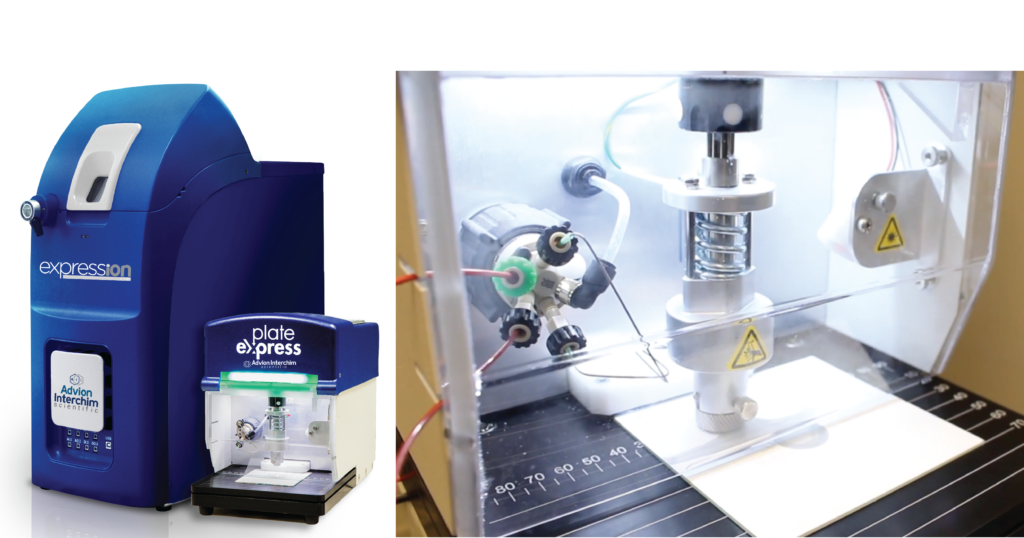
Instrumentation
Mass Spec: expression® CMS
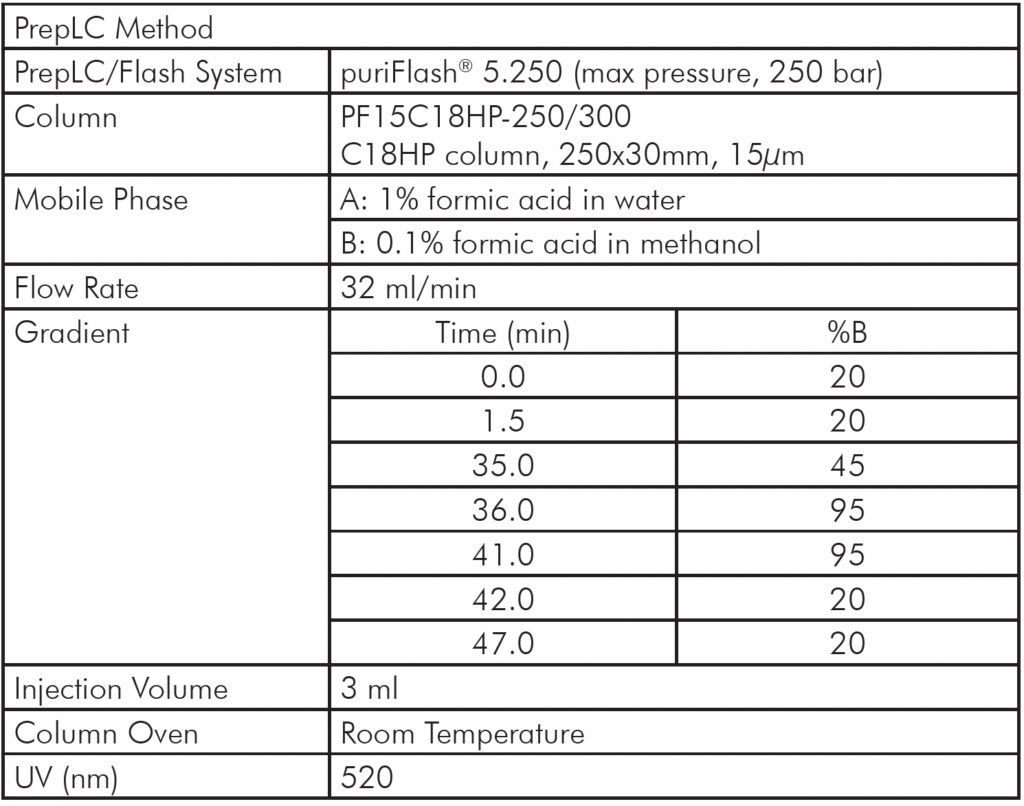
Flash: puriFlash® 5.250 prepLC
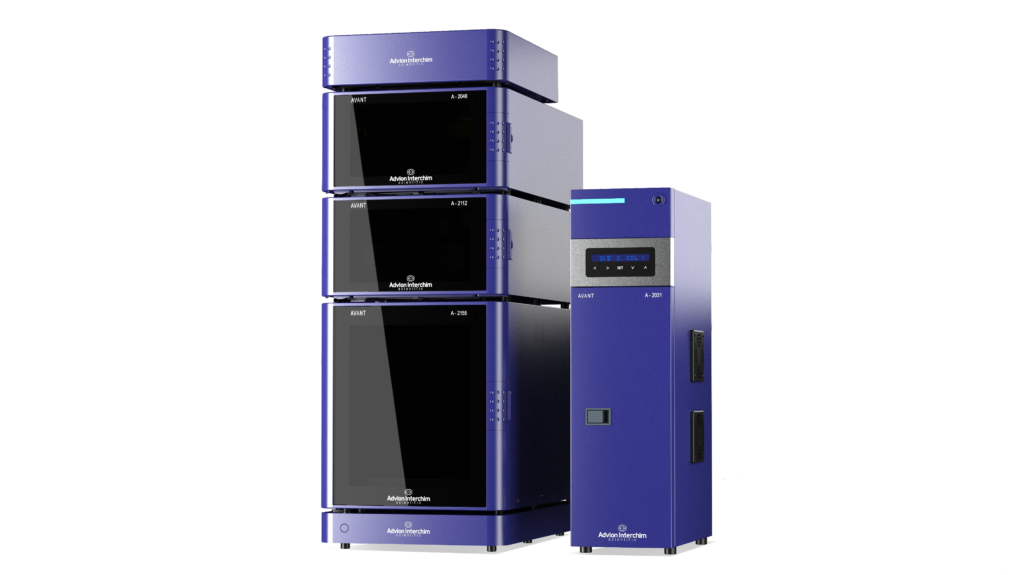
HPLC: AVANT®
Author
Changtong Hao
Advion Interchim Scientific
Introduction
In recent years, biopharmaceutical companies have increasingly embraced peptide/protein-based drugs due to their enhanced specificity and selectivity compared to traditional small molecule drugs. However, the purification of peptides/proteins during the drug discovery process is crucial to ensure the safety and efficacy of the final product. Attaining the highest possible purity levels for the bioactive target compounds is essential in minimizing the risk of toxicity and complying with regulatory standards.[1,2]
Whey protein isolate, a by-product of cheese production, contains various glycomacropeptides and two significant bioactive peptides, casein macropeptide A (CMPa) with a molecular weight (MW) of 6757 Da and casein macropeptide B (CMPb) with a MW of 6787 Da. Extracting and purifying individual components, such as casein
macropeptide, is essential for investigating their bioactivity.[3]
In this application note we use whey protein isolate and two casein macropeptides as an example to demonstrate the isolation and purification of bioactive components with a system comprised of a puriFlash® 5.250 prepLC coupled online to an expression® CMS detector. This combination offers higher selectivity and sensitivity compared to traditional detectors such as UV or ELSD, which may not effectively respond to bioactive target peptides and proteins.
Advion Interchim Scientific
puriFlash® 5.250
Advion Interchim Scientific
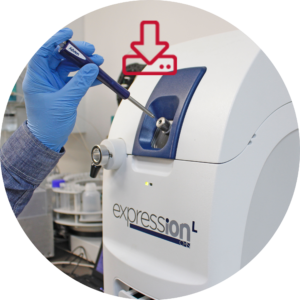
expression® CMS
Method
Preparation of Whey Protein Isolate
• The casein macropeptide isolation procedure used in this application is based on Tadao Saito’s work[4] with some modifications.
• A 50 g sample of whey protein isolate purchased from local grocery store was combined with 500 mL of a solvent mixture of 70% water and 30% methanol (v/v). The mixture was sonicated at 70°C for 90 minutes and then filtered under reduced pressure.
• The resulting filtrate was concentrated to a volume of 300 mL by removing methanol using a rotary evaporator under reduced pressure at 40 °C. It was then stored at 4°C for one hour. Subsequently, an equal volume of cold ethanol was added to the solution, and the mixture was vortexed for 5 minutes before being stored at 4°C for an additional 4 hours.
• The mixture was filtered under reduced pressure using a 0.5 μm filter. The final filtrate was then concentrated to a volume of 50 mL using a rotary evaporator under reduced pressure.
• A 100 μL aliquot of the concentrated extract was mixed with 900 μL of deionized (DI)
water for analytical HPLC/MS analysis.
• The remaining filtrate was used for peptide purification using the puriFlash® 5.250 PrepLC system coupled with an expression® CMS detector.
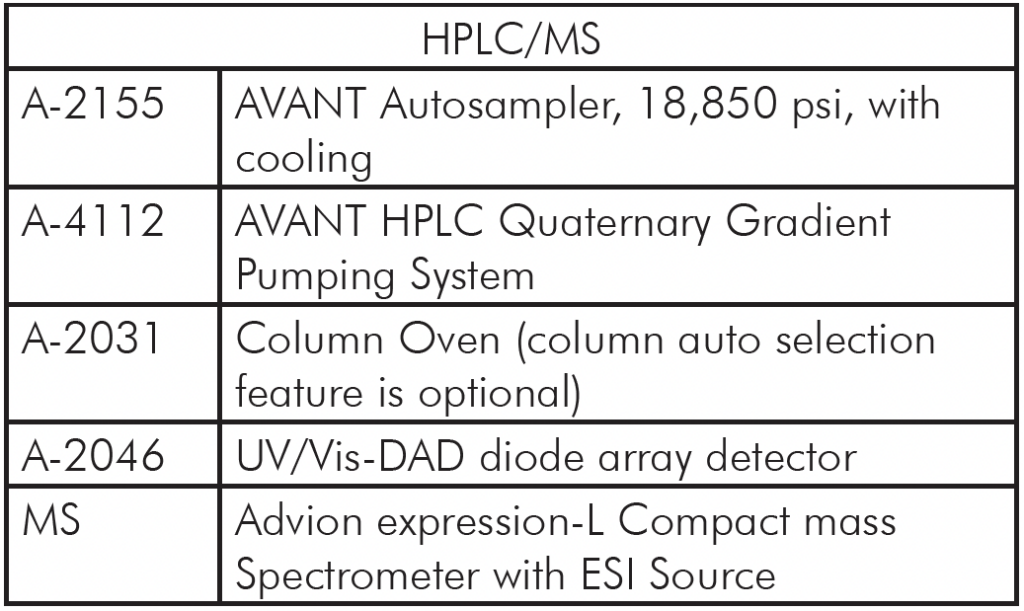
Table 1: Analytical HPLC/MS Method Setup
Analytical HPLC/MS Method Setup
The liquid extract from whey protein isolate was first analyzed using an AVANT® HPLC/CMS system and a chromatography separation method developed for the 4.6 mm column used (Table 1).
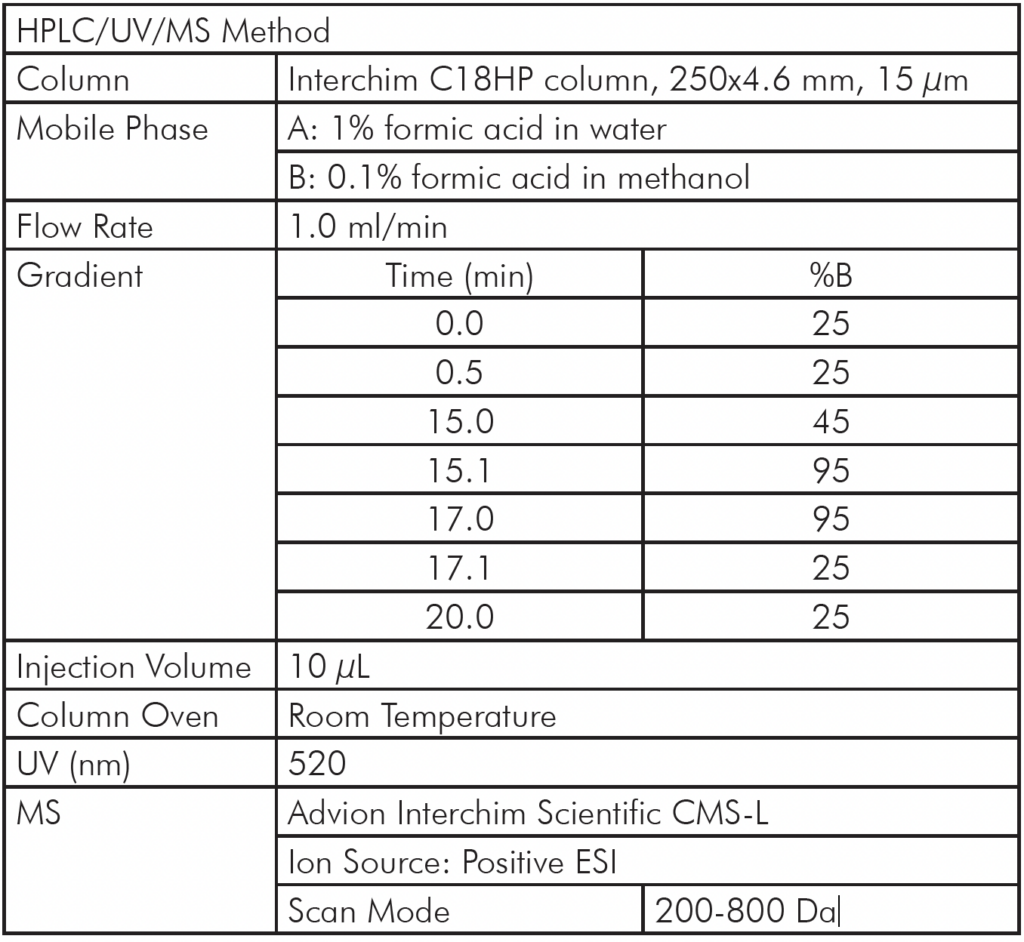
Figure 1a shows the HPLC/MS chromatogram of the liquid extract. The averaged MS spectra from the peak at 6.44 min indicates that the compound is a multiply charged peptide with at least five masses at m/z 755.2, 849.4, 970.6, 1132.1, and 1358.6 (Figure 1b) forming a charge profile.
Through software charge deconvolution, the uncharged mass of the peptide was determined to be 6787.4 Da, indicating casein macropeptide B (CMPb, theoretical mass of 6787 Da) (Figure 1c).
Advion Interchim Scientific
AVANT® (U)HPLC
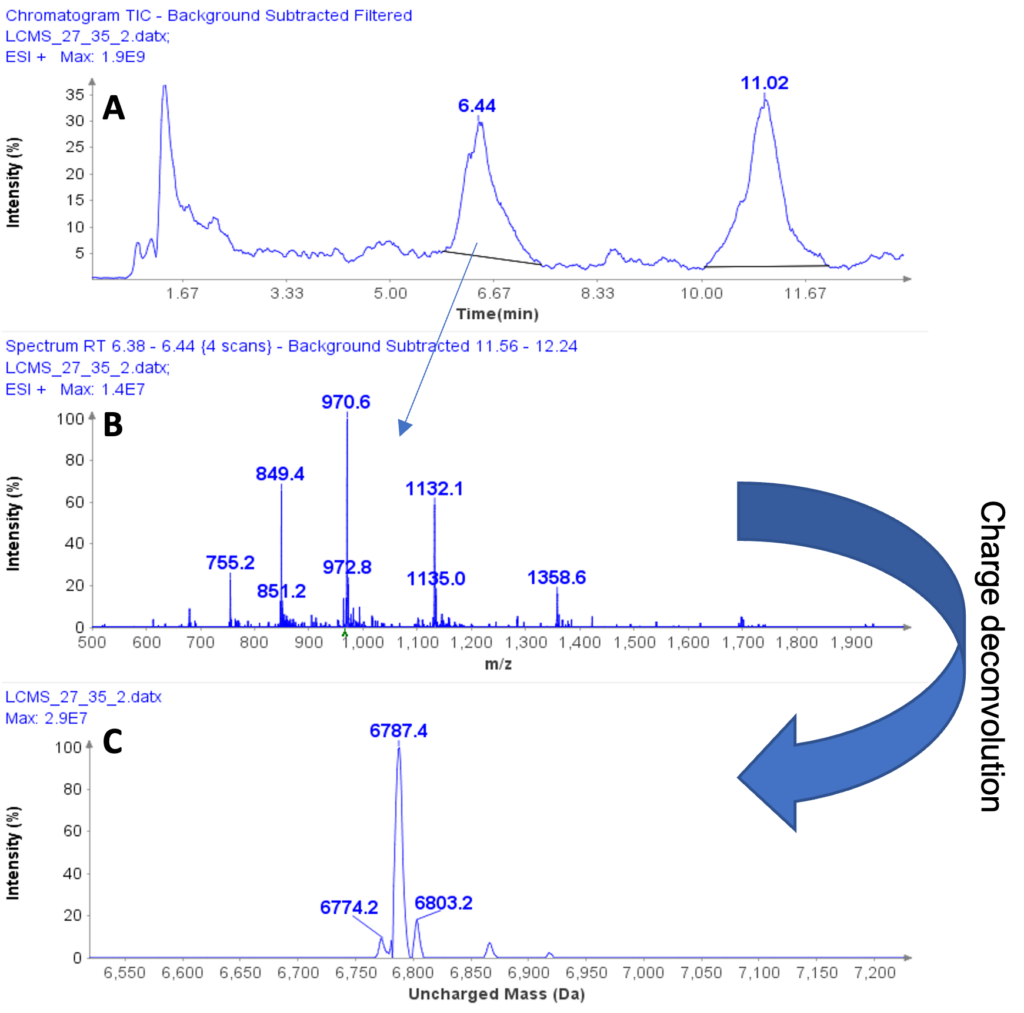
Figure 1: (a) HPLC/MS chromatogram of liquid extract from whey protein isolate, (b) The averaged MS spectra from peak at RT 6.44 min, (c) The deconvoluted, uncharged mass of the peptide eluting peak at RT 6.44 min.
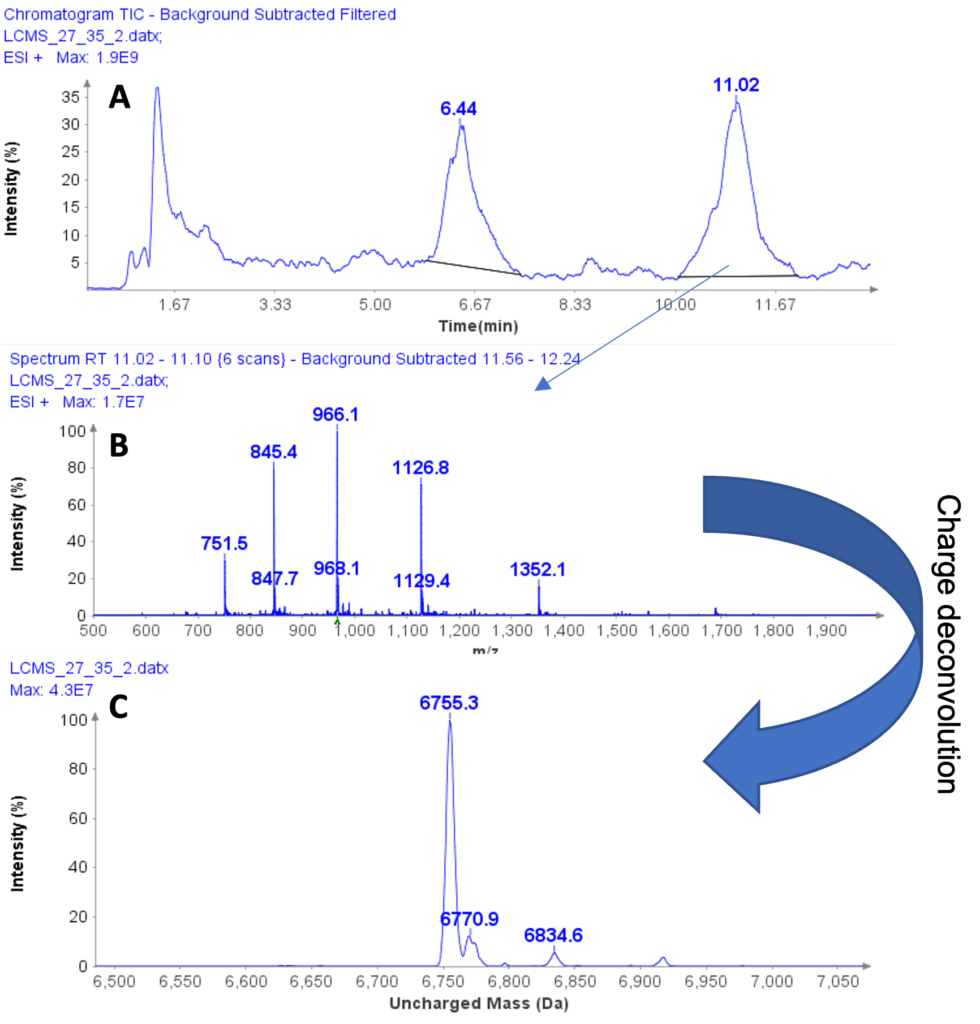
Figure 2: (a) HPLC/MS chromatogram of liquid extract from whey protein isolate, (b) The averaged MS spectra from peak at RT 11.02 min, (c) The deconvoluted, uncharged mass of the peptide eluting at RT 11.02 min.
The averaged MS spectra obtained from the peak eluting at 11.02 min suggest that the compound is also a multiply charged peptide with masses at m/z 751.5, 845.4, 966.1, 1126.8, and 1352.1 (Figure 2b) forming its charge profile.
Similarly, charge deconvolution determines the uncharged mass of this peptide to be 6755.3 Da indicating the A variant of casein macropeptide, CMPa with a theoretical mass of 6755 Da (Figure 2c).
Advion Interchim Scientific
puriFlash® 5.250, MS Splitter and expression® CMS
PrepLC/MS Chromatography
In a next step, the analytical separation method was transposed to the larger prep scale from 4.6 mm column ID to 30 mm ID column ID and further optimized for the purification of the two CMPs (casein glyco-macropeptides) on the puriFlash® 5.250 PrepLC/Flash system coupled online to the expression® CMS detector.
The PrepLC-UV/MS chromatogram of the whey protein isolate is shown in Figure 3 and parameters shown in Table 2.
Fraction collection was triggered based on the MS signal, chosen for its higher selectivity and sensitivity. XIC of 970-971 Da was used to detect CMPb, and XIC of 965-966 Da for CMPa.
The organic solvent in the combination of fractions 11-17 and fraction 18-22 was removed using a rotary evaporator under negative pressure, and the remaining aqueous
solution was dried using a LABCONCO Freezone 2.5L (-50 C) lyophilizer, resulting in a dry collection of 10 mg each, which was then dissolved in 10 ml of deionized water for subsequent HPLC/UV/MS analysis. The results of the purity analysis are shown in figures 4 and 6.
Table 2: PrepLC/MS Method Setup
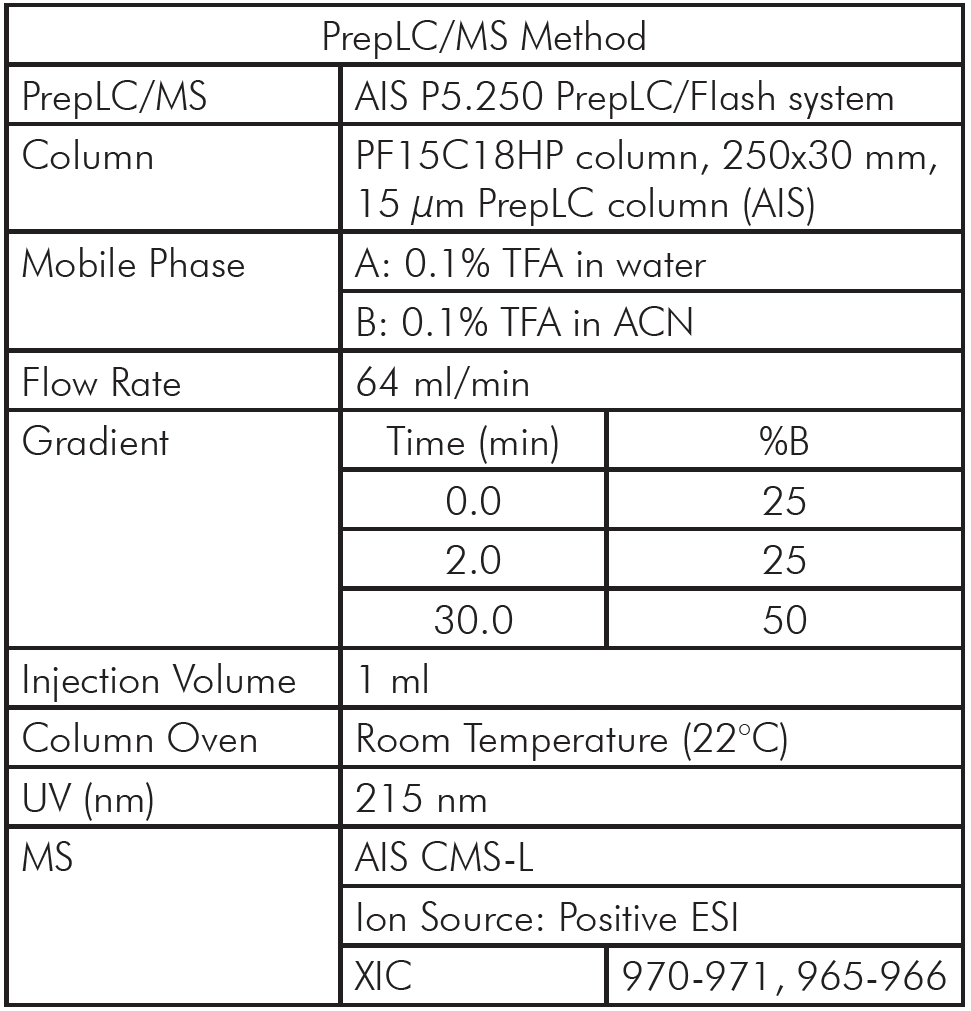
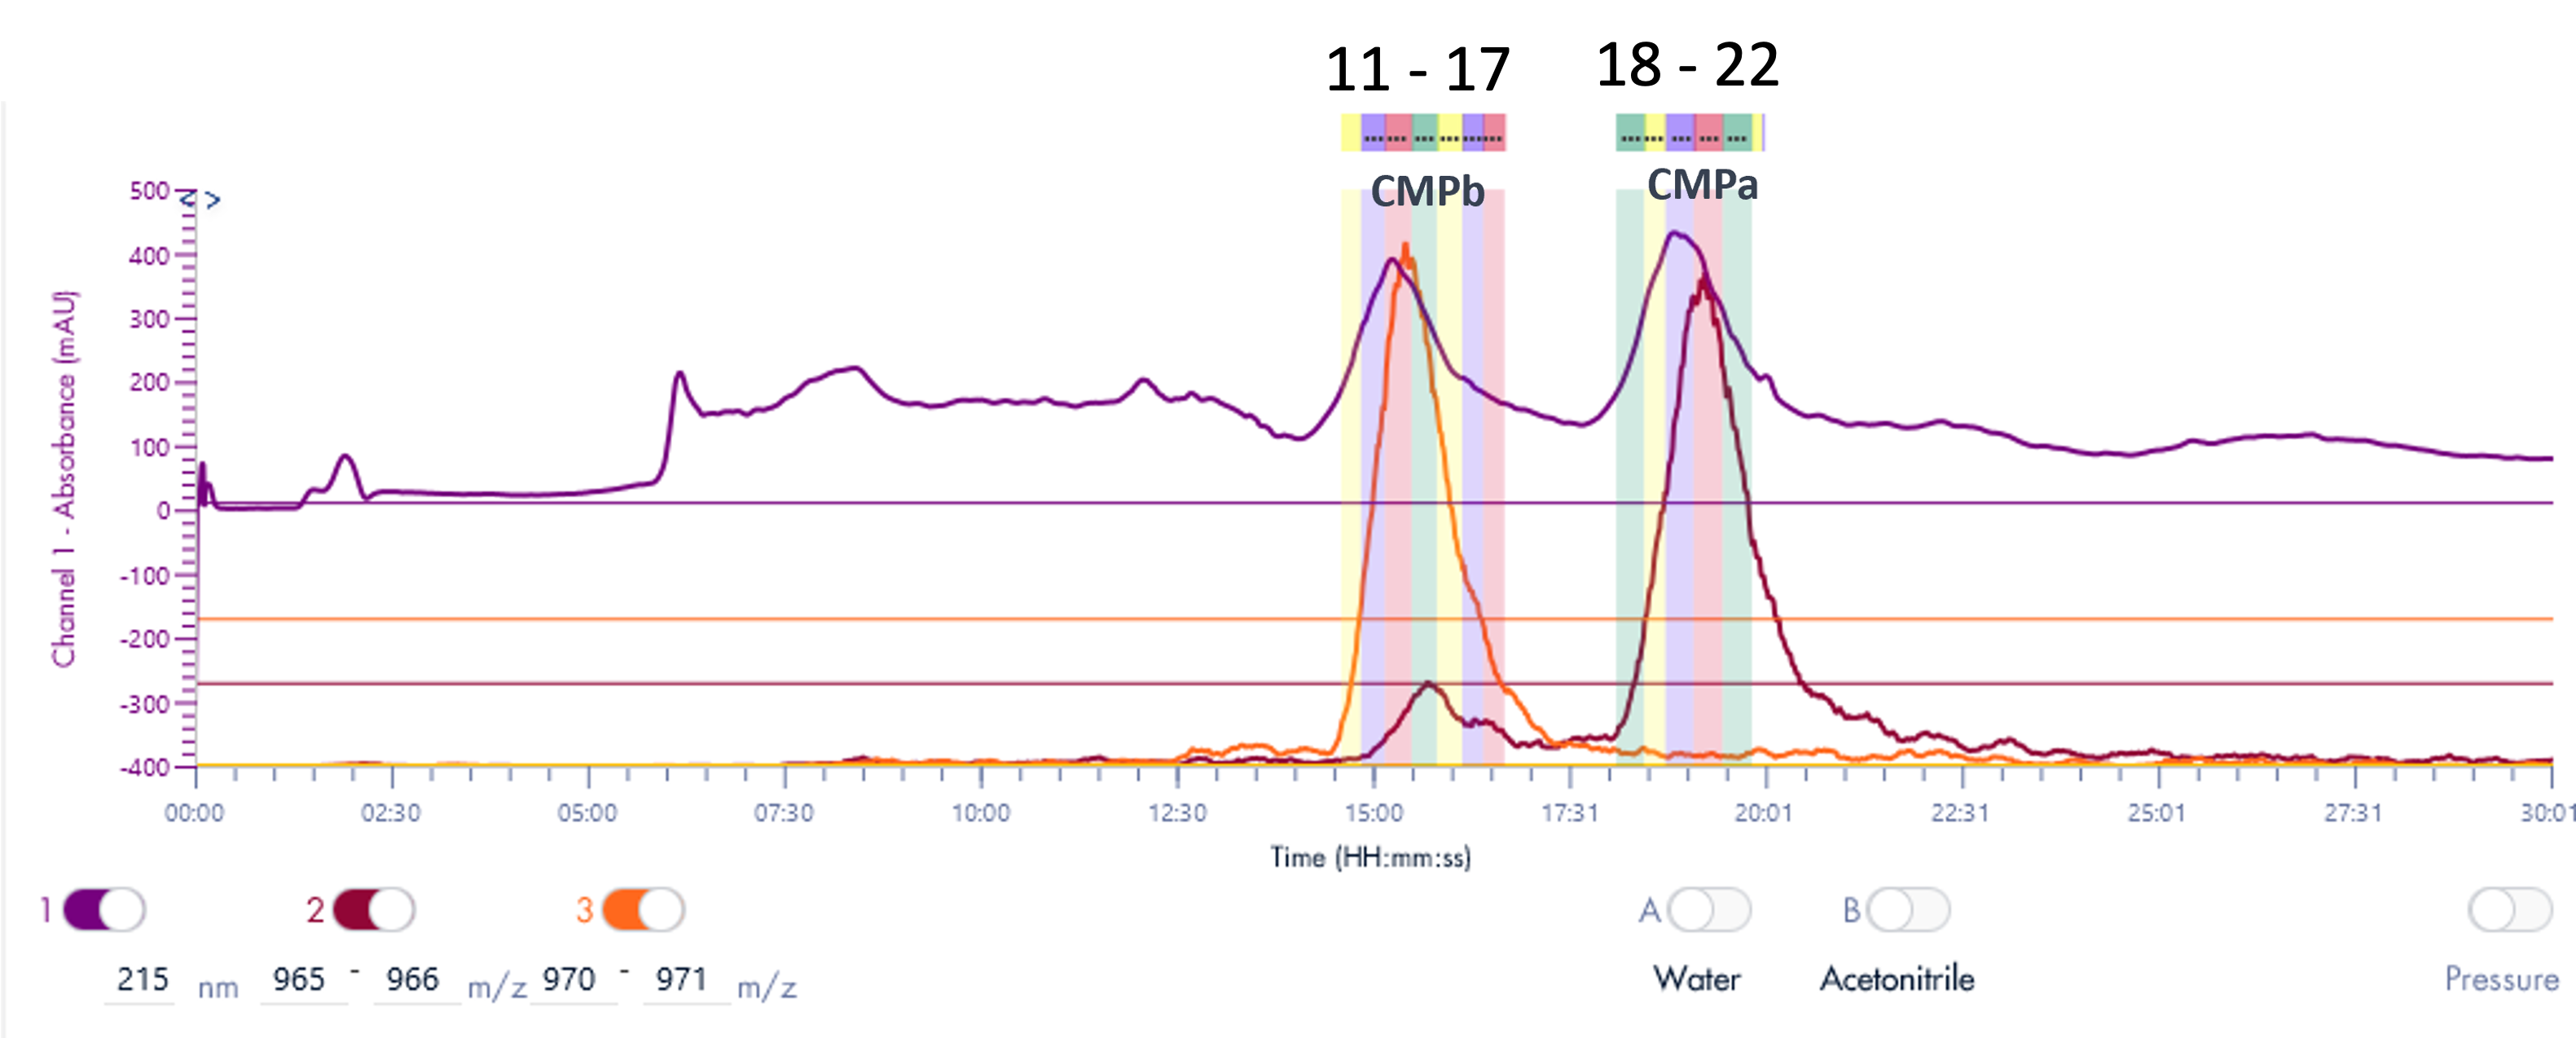
Figure 3: The PrepLC-UV/MS chromatogram of two whey protein isolate
Results
Purity Analysis of CMPb
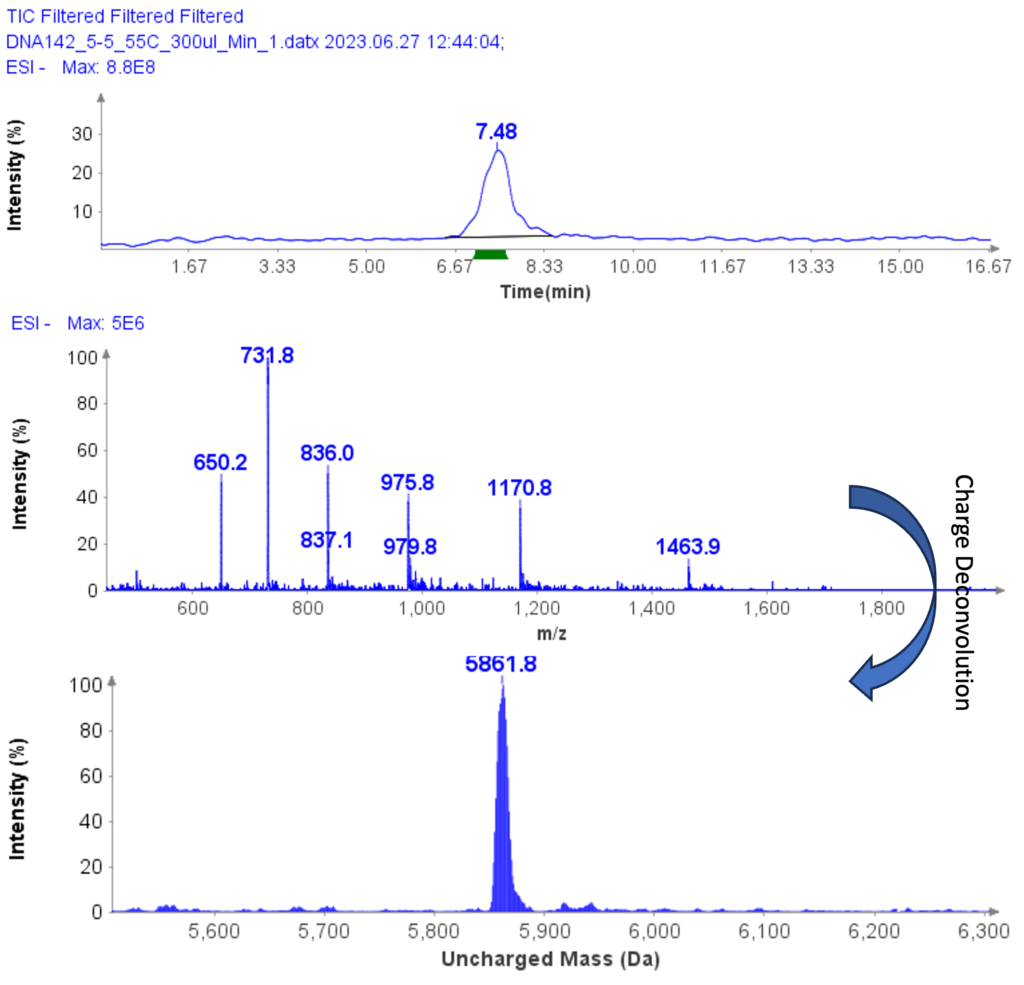
Purity analysis of CMPb in the pooled fractions 11 to 17 is shown in Figure 4. MS analysis shows that four major ions were detected with m/z at 970.8, 1132.3, 1358.6 and 1968.2 (Figure 4b).
With the averaged mass spectra from Figure 4b, the uncharged mass of the peak at 5.94 min was determined to be 6788.4 (CMPb, Figure 4c). However, MS analysis can also detect four minor components at 6758.3, 6773.5, 6804.8 and 6868.4 Da.
The obtained UV purity of CMPb is 86.7% (Figure 4d), but, based on the additional MS data, the compound purity is actually less then that (estimated 80%).
CMPa in the pooled fractions 18 to 22 was measured to be 94.7% (figure 5a) based on UV analysis of the analytical run.
The deconvoluted uncharged mass analysis shows the expected dominant mass 6756.2 of CMPa (figure 5b), and one minor component at 6774.6, an oxidized form of CMPa.
Again, this example shows the value of MS detection of bioactive compounds such as peptide and proteins, and the better specificity of MS detection compared to UV.
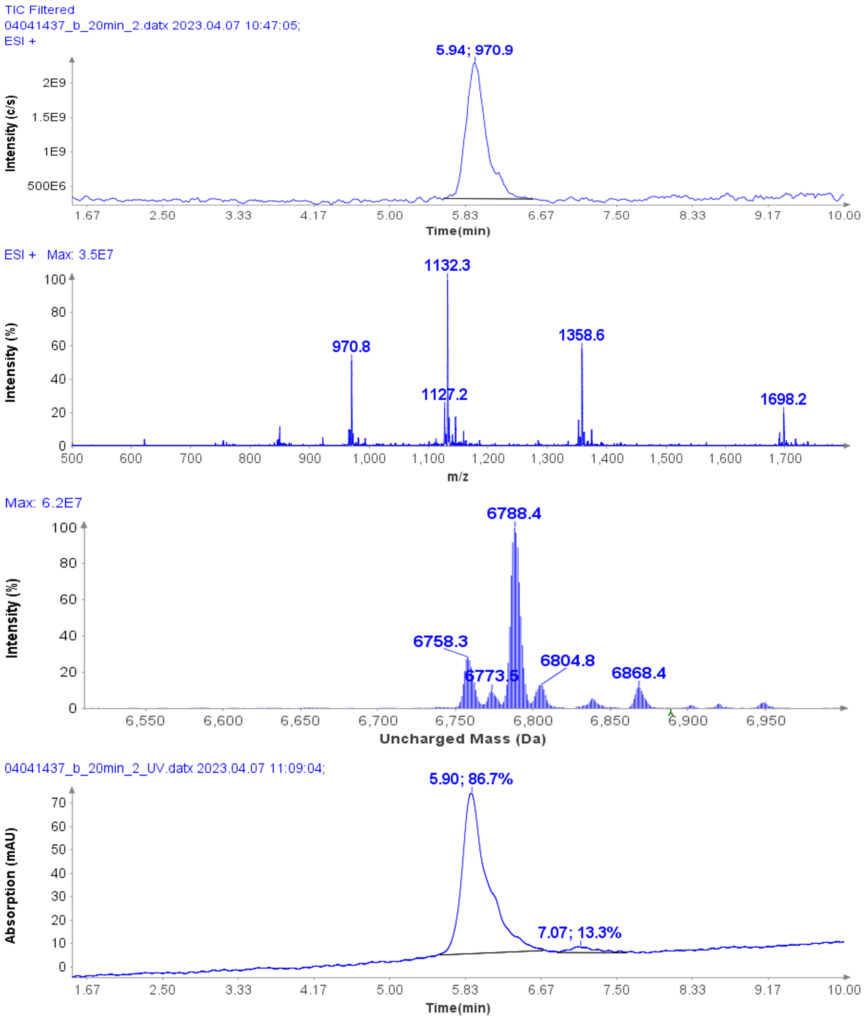
Figure 4: (a) The HPLC-MS chromatogram of pooled fractions of 11-17, (b) Averaged MS spectra of peak eluting at RT 5.94 min, (c) the uncharged mass from (b), (d) The HPLCUV chromatogram of pooled fractions of 11-17.
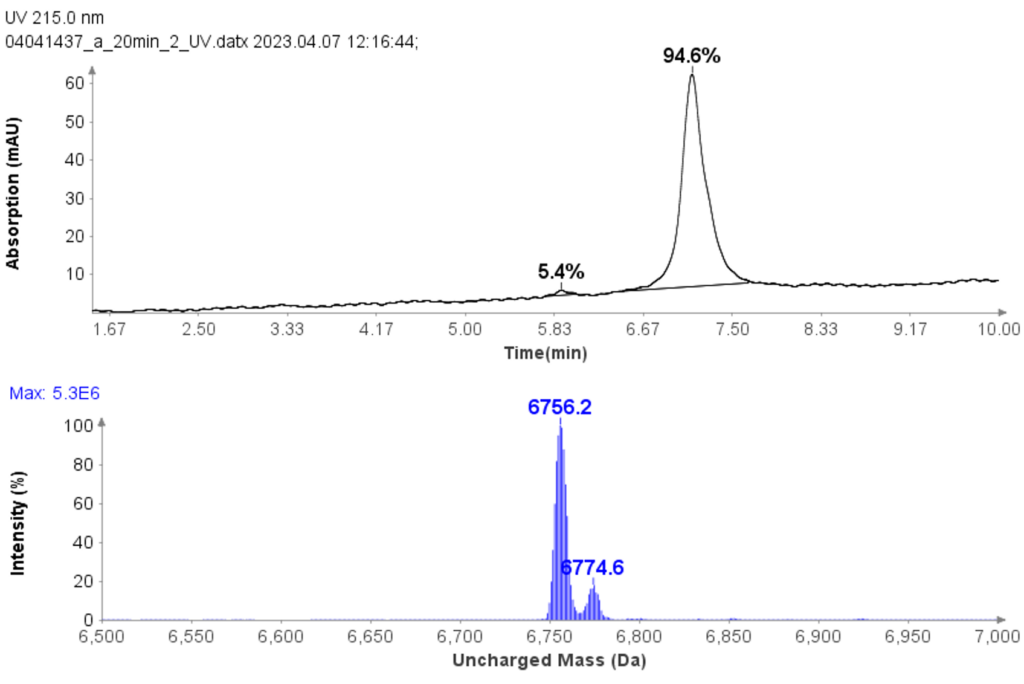
Figure 5: (a) The HPLC-UV chromatogram of pooled fractions of 18-22. (b) deconvoluted uncharged mass of CMPa.
The final overall purity is estimated to be ca. 90%, an excellent value for a bioactive molecule in drug discovery.
Further improvement in purity can be achieved with selective fractions – at the cost of yield. For example, the HPLC-UV/MS analysis of fraction 20 of CMPa (Figure 6a) shows a UV purity of 99.0% (Figure 6d) and no oxidized by-product in the MS analysis.
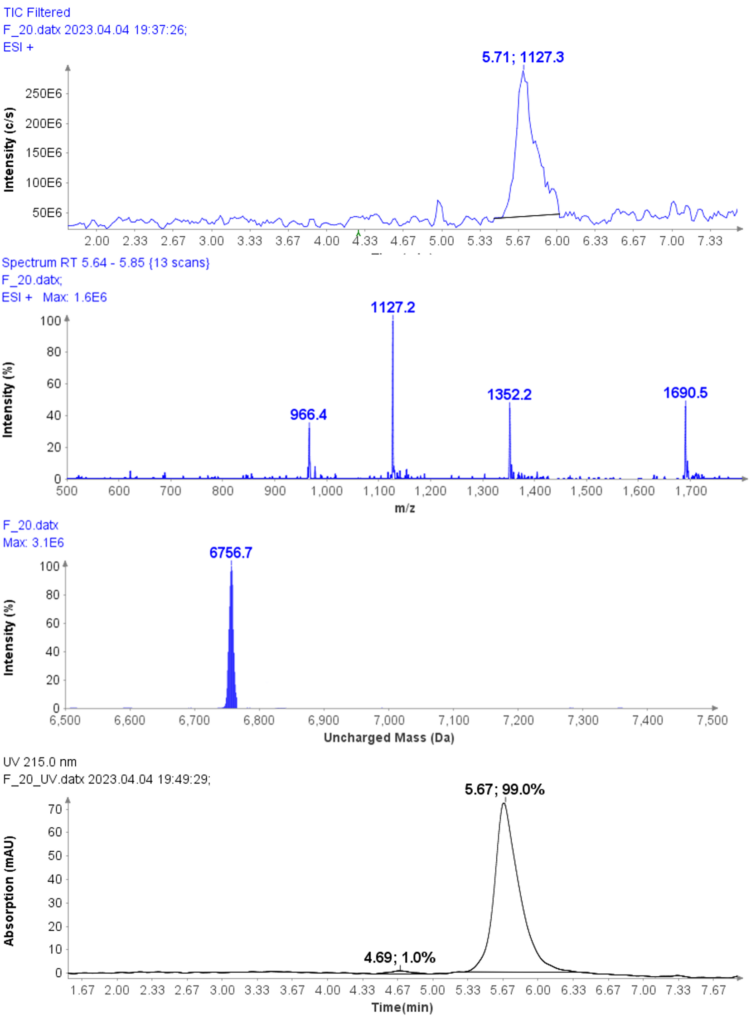
Figure 6: (a) The HPLC-MS chromatogram of fraction 20, (b) Averaged MS spectra of peak at RT 5.71 min, (c) deconvoluted uncharged mass of CMPa (d) The HPLCUV chromatogram of fractions 20.
Conclusion
The puriFlash® 5.250 PrepLC/Flash system, coupled on-line with an expression® CMS detector, achieves outstanding performance, facilitating the selective purification of bioactive macropeptides from a complex matrix with high level of confidence. Compared to UV or ELSD detectors, the mass spectrometer delivers superior selectivity and sensitivity.
An illustrative application of this approach shows the isolation of casein glycol-macro-peptides, resulting in a purity range of 80% (CMPb) to 90% (CMPa) through combined fractions with high yield. Even higher purity of up to 99.0% can be achieved with selective fractions.
REFERENCES
[1]Gräslund, S., et al. (2008). Protein production and purification. Nature methods, 5(2), 135-146.
[2]Biopharmaceutical Processing: Development, Design, and Implementation of Manufacturing Processes.
[3]Lin T., et al. (2021) Bioactives in bovine milk: chemistry, technology, and applications Nutrition Reviews v79(S2):48–69
[4]Saito T., er al. (1991) A new isolation method of caseinoglycopeptide from sweet cheese whey. J. Dairy Sci. 74, 2831-2837