Instrumentation
Mass Spec: Thermo Scientific Orbitrap® Instruments
Sampling: TriVersa NanoMate LESA®
Authors
Josh Coon, PhD
University of Wisconsin-Madison and CeleramAb™
Daniel Eikel, PhD
Advion Interchim Scientific®
Introduction
In contrast to small molecule drugs, biologics (or protein therapeutics) such as antibodies can be very powerful drugs because they target biological pathways with much higher specificity thereby enabling treatment of complex diseases such as cancer, autoimmune disorders or metabolic conditions and reducing unwanted side effects at the same time. Precise characterization of these biologics – including their structure, post-translational modifications, stability, and activity—is essential to ensure their safety, efficacy, and consistency across production batches. Even small changes in protein folding caused, for example, by a chemical modification on one amino acid can diminish a protein therapeutics’ function or worse, trigger unwanted immune responses. Rigorous analytical methods therefore guide optimal design, manufacturability, and quality control. Accurate characterization also supports regulatory approval and helps identify biomarkers or mechanisms that improve therapeutic performance and patient outcomes.
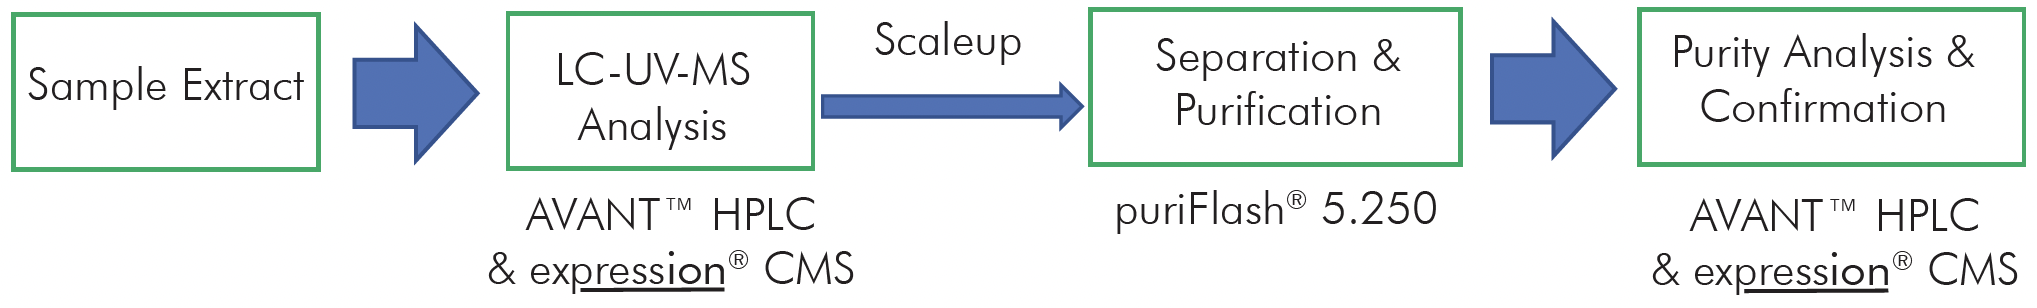
Here we describe a protein/antibody characterization approach based on standardized enzymatic digestion in 96 well plates, the rapid injection of the generated peptides into high resolution mass spectrometers and subsequent automated data analysis for full protein sequence characterization of up to 1000 mAbs a day (Figure 1).
Advion Interchim Scientific® Systems

TriVersa NanoMate LESA® with ESI Chip® Technology

 Figure 1: Combining the technology from CeleramAb™ and Advion Interchim Scientific® to create a protein therapeutic analysis approach based on enzymatic protein digestion, direct infusion MS, MS/MS and automated data processing to achieve a 1000 mAbs throughput a day.
Concepts & Experiments
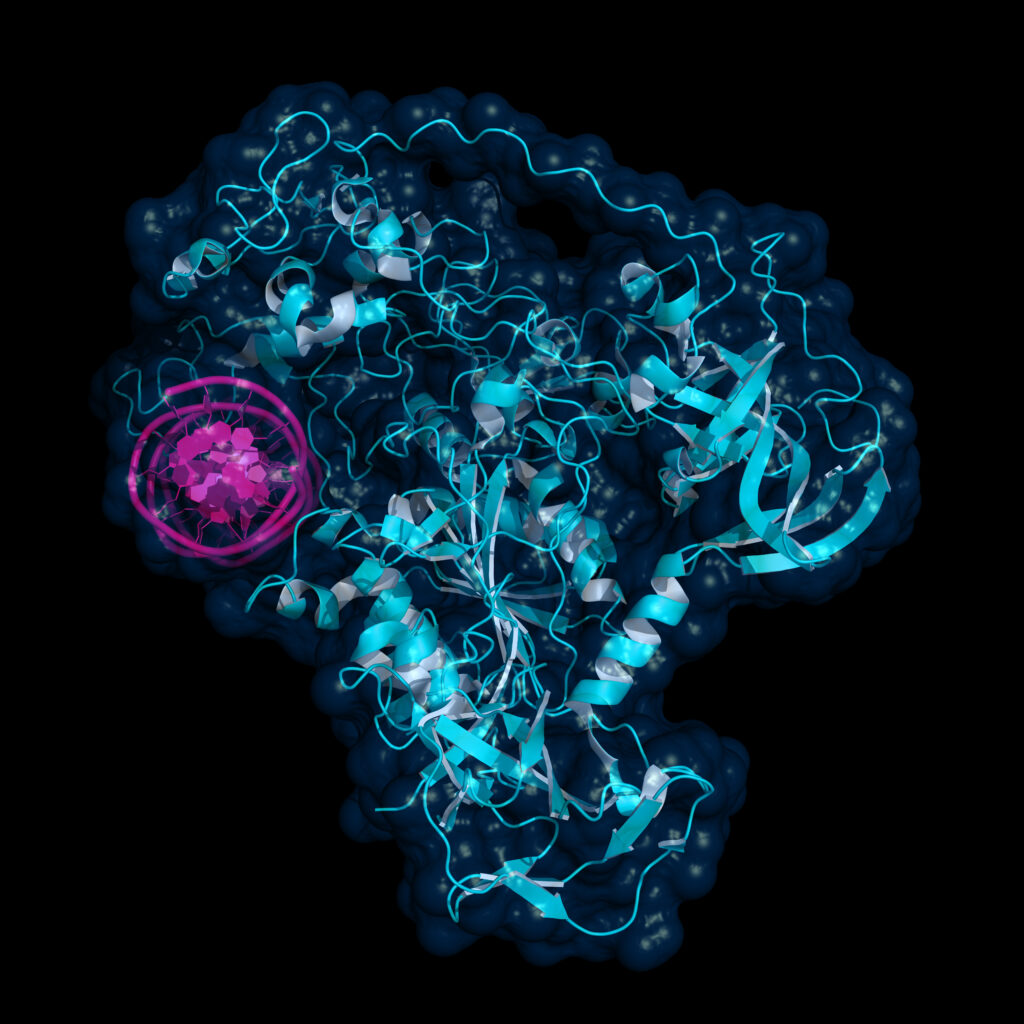
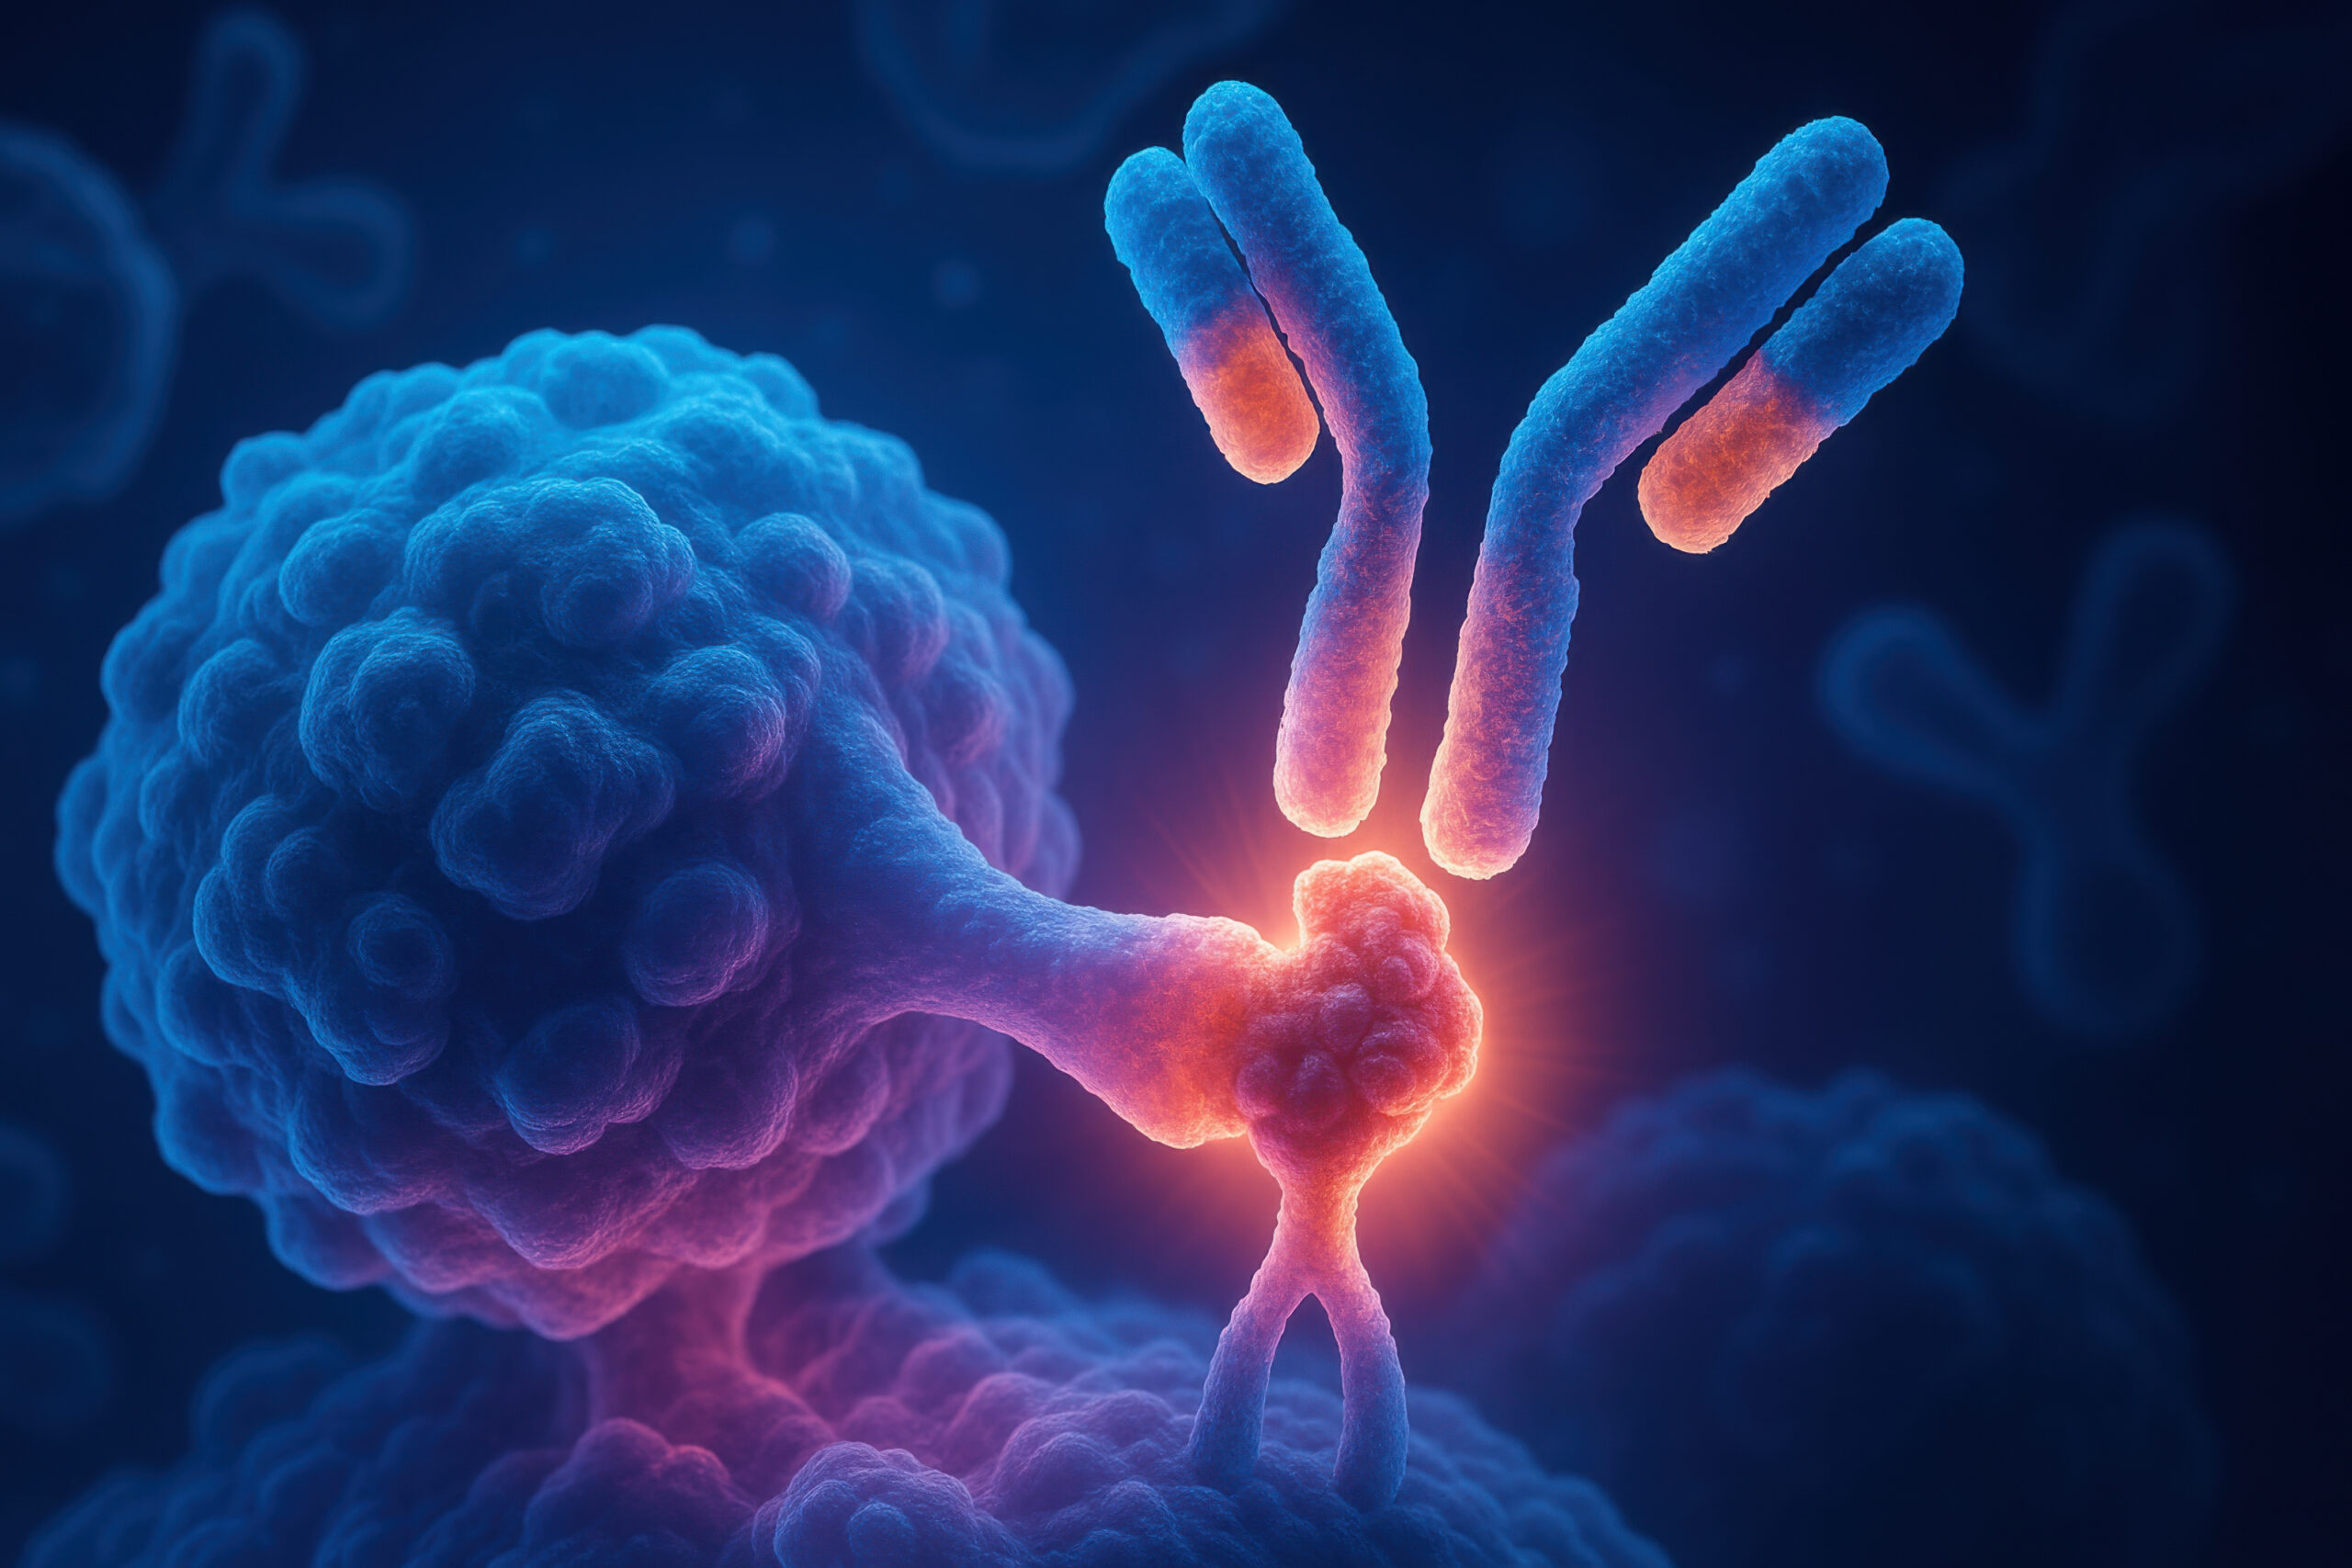
Protein therapeutics can degrade based on various factors such as time, pH changes, light or heat exposure causing changes to amino acids along the peptide sequence of the biologic drug, changes like deamidation, oxidation or pyrolization, which may cause folding and function changes. Figure 2 depicts typical changes observed on an antibody. Other changes in the glycosylation, phosphorylation or Cys-Cys oxidation state will also impact the folding and function of a biologic. All these modifications must therefore be investigated, characterized and ultimately routinely maintained and controlled to generate a valuable new drug.
 Figure 2: Protein therapeutics can degrade based on various factors such as time, pH changes, light or heat exposure causing changes to amino acids along the peptide sequence of the biologic drug, changes like de-amidation, oxidation or pyrolization.
A typical way to analyze protein sequences is the enzymatic digestion of the protein to its peptide building blocks and their respective analysis in LC-MS/MS. The chromatography separates the peptides in time and mass spectrometry allows the mass spectral analysis of the peptides generating fragmentation ions and therefore sequence information. Historically, such LC-MS/MS runs took a long time, with 30-120 minutes being typical run times, and required extensive off-line data analysis to show complete sequence coverage and characterization of the protein. Both these factors severely limited the number of samples that could be processed in a day and indirectly limited the number of attempted experiments with therapeutic proteins.
Instead of time-consuming LC-MS/MS, we present an approach utilizing direct infusion (DI) mass spectrometry in an automated fashion. This approach has become viable since modern mass spectrometers have a much higher cycle time to run MSn experiments and allow for high mass accuracy and high mass resolution for unequivocal assignments of peptide sequences and modifications directly from the MS data. Development of an automated ion source based on ESI chip® technology provides consistent and highly efficient nano ESI ionization using a sample path of one sample, one tip and a new nESI emitter for every consecutive sample – eliminating cross contamination entirely. As shown in Figure 3, this approach utilizes standardized reagents in a 96 well format for the enzymatic digestion of antibodies following reproducible protocols, and the NanoMate Triversa automated robotic sample infusion system to ionize the generated peptides and analyze them in the mass spectrometer to generate information rich mass spectra of every sample in just one minute. Data processing is also automated with customized software to address both described bottlenecks above, resulting in a throughput of up to 1000 samples a day.
 Figure 3: Schematic of the peptide mapping workflow based on standardized antibody digestion of the protein therapeutic in 96 well plates, rapid and automated direct infusion high resolution mass spectrometry to generate information rich MS data (data is automatically processed for a throughput of 1000 mAbs a day).
Experimental Setup & Methods
Figure 4 shows a typical set of experiments with this Direct Injection – MS/MS (DI-MS/MS) approach. Here, two different samples (Antibody X and a NIST standard antibody) were tested for stability under heat and pH changes in triplicate.
After standard digestion, the samples were injected into the MS system as described and the raw MS data is shown. In a little over one hour, 42 samples covering the stability experiment and controls were analyzed. On the time line you can see bursts of MS data intensity for each of the 1 min infusion experiments followed by periods of no data (reflecting the time the robot takes to bring the next sample to the MS system). This one hour is roughly the same time frame typically consumed for only one sample in a traditional LC-MS approach.
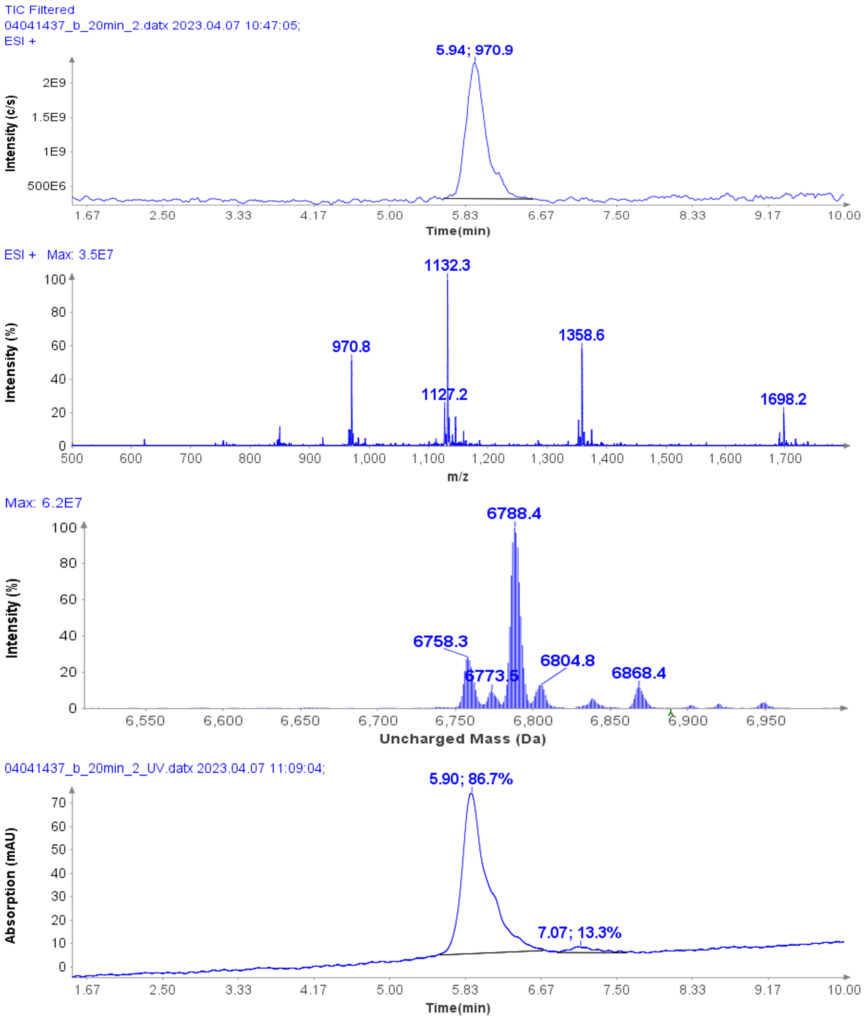
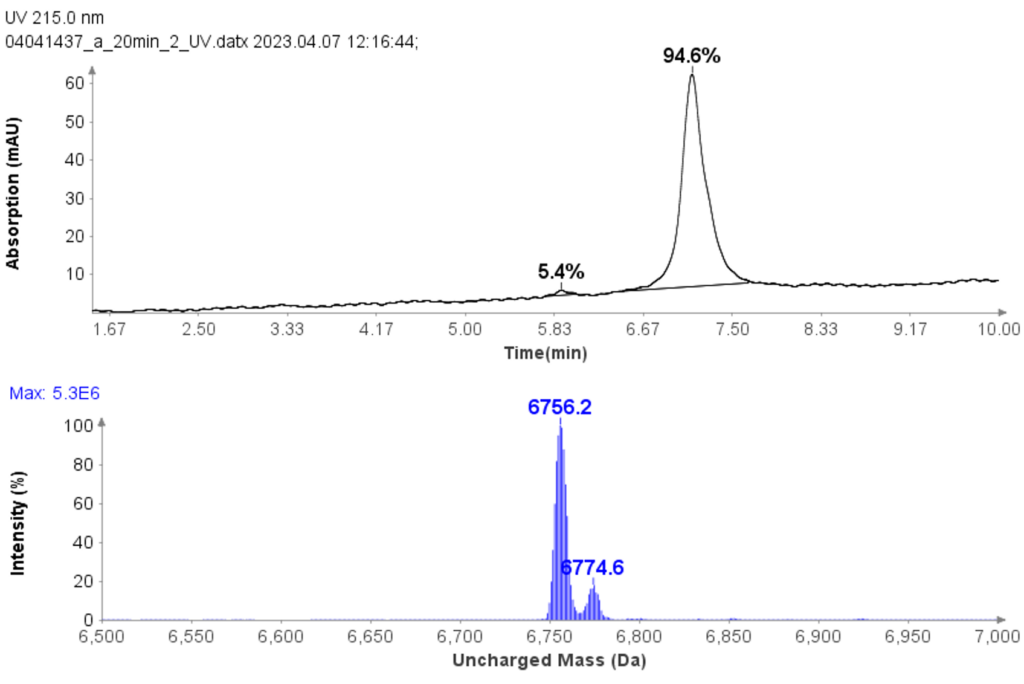
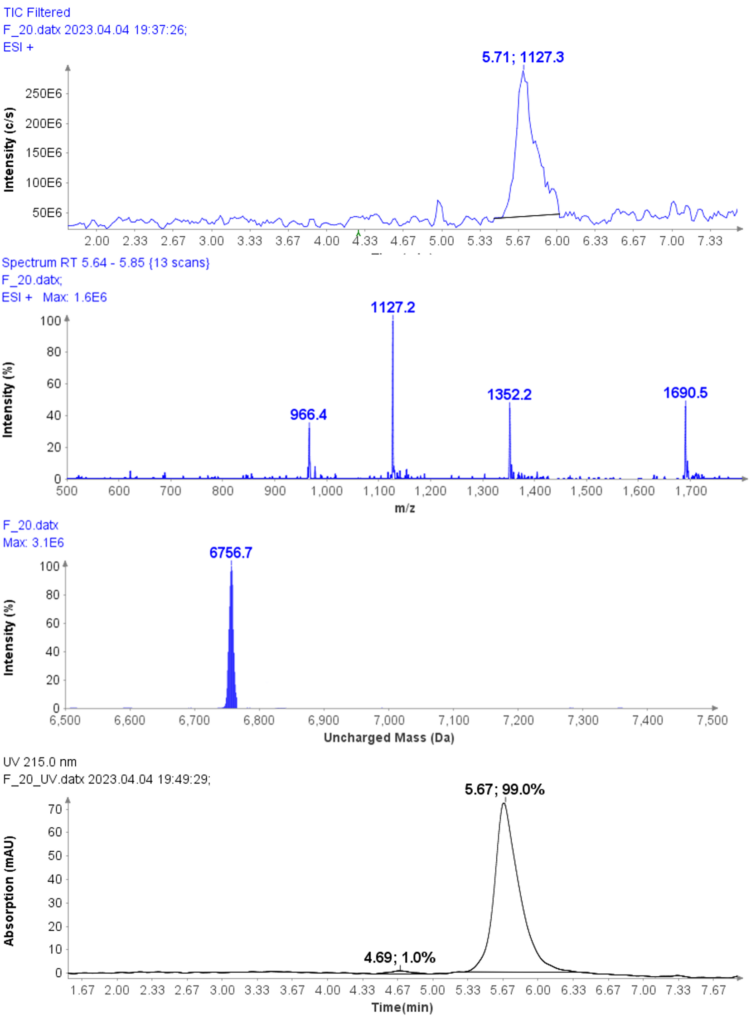
Example analysis of the peptide DTLMISR illustrates the work flow. Figure 5 shows the MS data of an oxidized methionine amino acid in the peptide sequence DTLM(ox)ISR of a therapeutic antibody. A typical LC-MS analysis approach would require 30-120 min to separate the protein digest followed by manual data inspection. However, the DI-MS/MS based approach only requires a 1 min run time with both related peptides (native and oxidized state) separated in the gas phase by their mass-to-charge ratio and detected by an automated mass shift algorithm. Calculations of the oxidation state is determined by ion intensity and calculated to 19.6% oxidation, which is in perfect agreement with the LC-MS result – however, the information is obtained in a fraction of time.
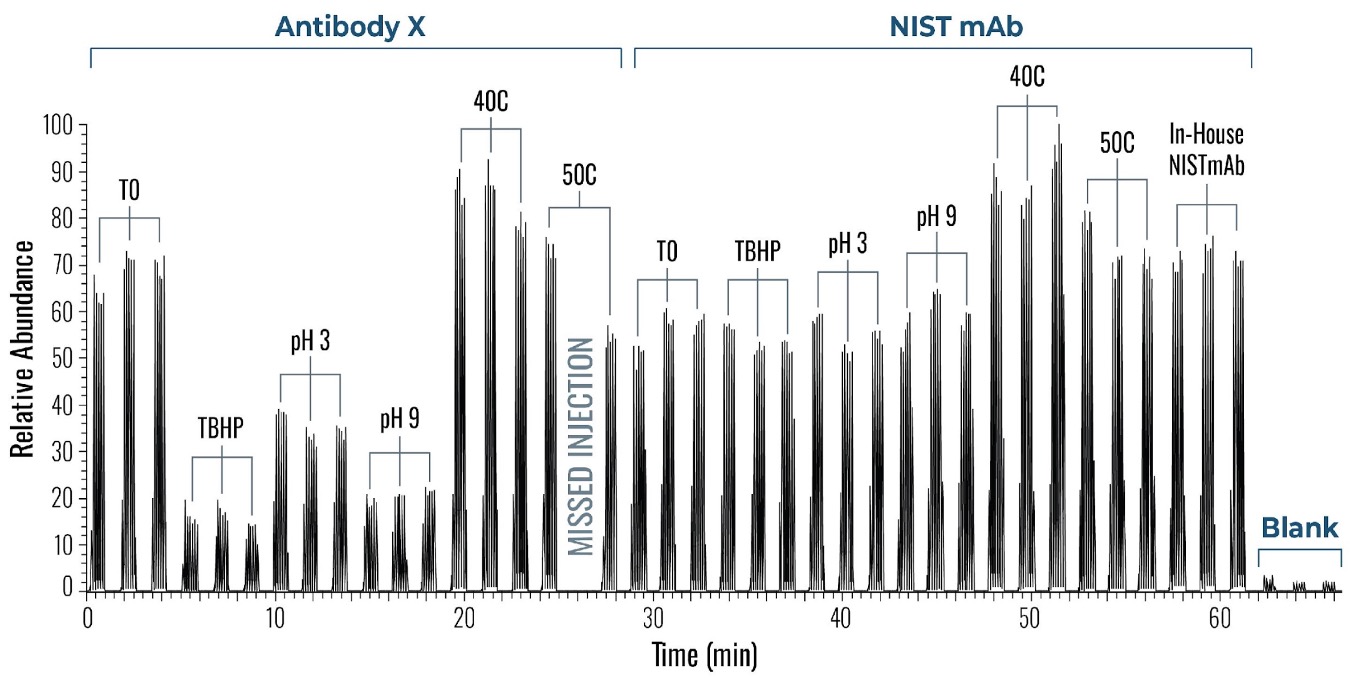 Figure 4: Example of a sample sequence with 14 samples run in triplicate within a little over one hour. Both proteins (antibody X and a NIST standard mAb) were exposed and tested against various conditions (pH and temperature). Each run represents 1 min infusion MS data collected for further processing and peptide identification and modification analysis.
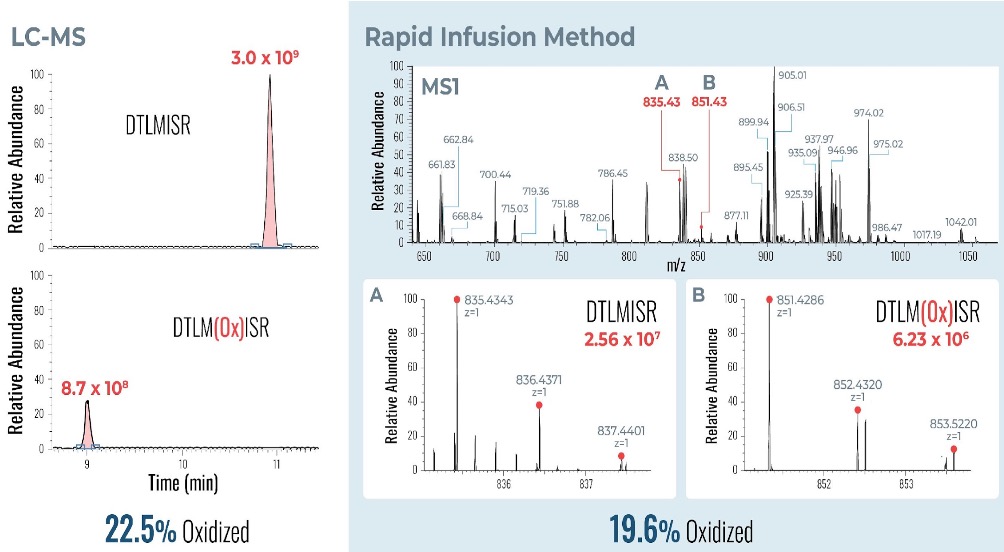
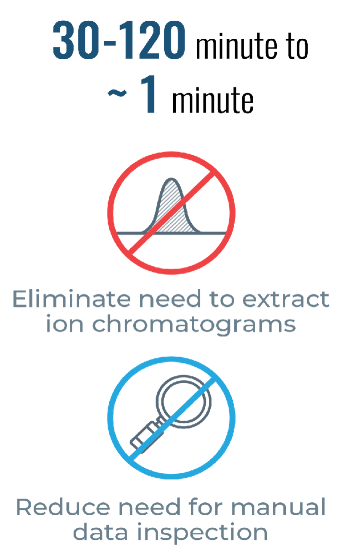
Figure 5: Example data analysis of an oxidized methionine amino acid in the peptide sequence DTLMISR of a therapeutic antibody. Typical LC-MS/MS analysis approach would require 30-120 min to separate the protein digest followed by manual data inspection. However, the Direct Infusion-MS/MS based approach only requires a 1 min run time with both related peptide sequences separated in the gas phase and detected by an automated mass shift algorithm. Calculations of the oxidation state is determined by ion intensity and calculated to 19.6% oxidation, which is in perfect agreement with the LC-MS/MS result – however the information is obtained in a fraction of time.
Conclusion
The Advion Interchim Scientific® TriVersa NanoMate® automated ion source is the perfect tool to support high throughput workflows in the characterization of therapeutic proteins based on peptide mapping strategies. In combination with the CeleramAb™ standardized reagent kit, mass spectrometry run methods and automated analysis software tools we can achieve a throughput increase by a factor of 100 compared to standard LC-MS approaches resulting in up to 1000 mAbs analyzed in a day.