Mass Directed Fraction Collection of Natural Products: Examples from Turmeric & Green Tea Extract

Introduction

Natural products have been a source of inspiration for pre-clinical drug discovery both by exploring traditional medicines and to discover new spaces in pharmacology. Isolation and characterization of natural products remains a major barrier in drug discovery. Isolation is generally done on an analytical scale and then compounds are characterized fully before any scaleup purifications are attempted. The ability to purify compounds in complex natural product mixtures by highly specific MS data allows for the simplification of the purification and characterization steps of the process. Here, flash and prep chromatography are coupled with MS detection to purify natural products in green tea and turmeric extracts. 

Methods

Isolation of the major catechins in green tea and the major curcuminoids in turmeric was completed via extractions. Green tea leaves were extracted, and the crude material was analyzed using UPLC-MS and analytical standards to identify the catechins of interest and develop a suitable prep-LC method for isolation. Turmeric powder was extracted and then analyzed by TLC-MS using Advion’s Plate Express to identify the compounds of interest and develop a suitable flash chromatography method for isolation. Both extracts were purified using mass-directed fraction collection using Interchim’s puriFlash 5.250 flash/prep chromatography system connected to Advion’s expression® single quadrupole mass spectrometer. Target compounds were detected using XIC MS channels. Purity of the isolated compounds was then determined using HPLC-MS.

Preliminary Data

We were able to successfully isolate the 3 major curcuminoids (curcumin, demethoxycurcumin, and bisdemethoxycurcumin) in turmeric and the 5 major catechins in green tea ((-)-epigallocatechin (EGC), (-)-epicatechin (EC), (-)-epigallocatechin-3-gallate (EGCG), (-)-epicatechin-3-gallate (ECG), and (-)-gallocatechin gallate (GCG) with high purity (≥95%).   

An isocratic flash chromatography method (97:3 DCM:MeOH) was developed using TLC (97:3 DCM:MeOH) to purify the curcuminoids. The TLC plate was analyzed by APCI MS using the Plate Express which extracts spots directly from the plate with no need for sample preparation. Fractions were collected using extracted ion chromatogram (XIC) channels with APCI MS. Fractions were then characterized by ASAP MS and purity for each fraction was determined using HPLC-MS. 

A preparative LC method was developed for the catechins in green tea using HPLC-MS and reference standards to identify each compound of interest. Using a water methanol gradient and collecting fractions using XIC channels set for the compounds of interest. Fractions were characterized and their purity determined by HPLC-MS. EGC, EGCG, GCG, and ECG fractions were determined to have purities of 100 %, 99.8 %, 98.8, and 100 % respectively.

Introducing the Advion Interchim Scientific SOLATION® ICP-MS

Introduction

The SOLATION® Inductively Coupled Plasma Mass Spectrometer (ICP-MS) puts the power of trace, multi-elemental analysis in your hands by simplifying and optimizing the typical ICP-MS workflow, inside and out. The system offers high performance, multi-elemental analysis, ideal for environmental, clinical, biomedical, food, agriculture, and geological applications.   

The SOLATION® offers a state-of-the-art quadrupole deflector that ensures the analyzer and detector stay clean and improves S/N by preventing neutrals and particles from entering the analyzer. The system is also designed for lower argon consumption. 

Key System Infrastructure Includes:

  • Ion extraction cones: Triple-cone ion extraction, followed by an Einzel lens, which are electrically controlled to maximize transmission of ions into the vacuum system. 
  • RF coil: Plasma generation with water cooled RF coil using industry standard 27 MHz variable frequency generator for rapid impedance matching and ultimate performance with challenging matrices. 
  • Torch: One-piece, demountable torch with fast, one-step connection of argon and ignitor. Optional shield to prevent secondary discharge. 
  • Nebulizer: High efficiency concentric nebulizer available in glass or quartz for compatibility with the widest range of flow rates and sample composition. 
  • Spray chamber: The cyclonic spray chamber with optional temperature control further reduces droplet size and solvent load to ensure stable, efficient plasma. 
  • Peristaltic pump: Integrated 4-channel, 12-roller pump for maximum flexibility and ultra-low pulsation. Software controlled flow rate from 1 μL/min to >1 mL/min. 
  • Gate valve: Allows quick and easy maintenance and replacement of the cones whilst maintaining vacuum integrity. 
  • 90° Quadrupole deflector: Ensures that the analyzer and detector are not in line with the plasma beam, preventing neutrals and particles from entering the analyzer, improving S/N and preventing contamination. 
  • Octupole collision cell: Acts as an ion guide and a collision cell with He gas to provide Kinetic Energy Discrimination (KED) to remove interferences. 
  • Quadrupole Analyzer: High frequency mass filter design with the highest stability to simultaneously maximize transmission, resolution, and abundance sensitivity. 
  • Dual function detectors: Measures in both analog and pulse detection modes with seamless transmission between the two, to allow measurement of high and low levels in a single analysis with more than 9 orders of magnitude of linear dynamic range. 
  • Pulse Detection: captures ions generating pulses shorter than 20 ns; accurate and linear to minimum dwell time of less than 100 μs 
  • Analog Detection: used for higher ion signals while pulse detection is deactivated to extend detector lifetime. 
  • Mass Dependent software control: Software designed to optimize specific mass ranges independently to allow for mass specific tune optimization.  

Analysis of Heavy Metals in Cannabis using the SOLATION® ICP-MS

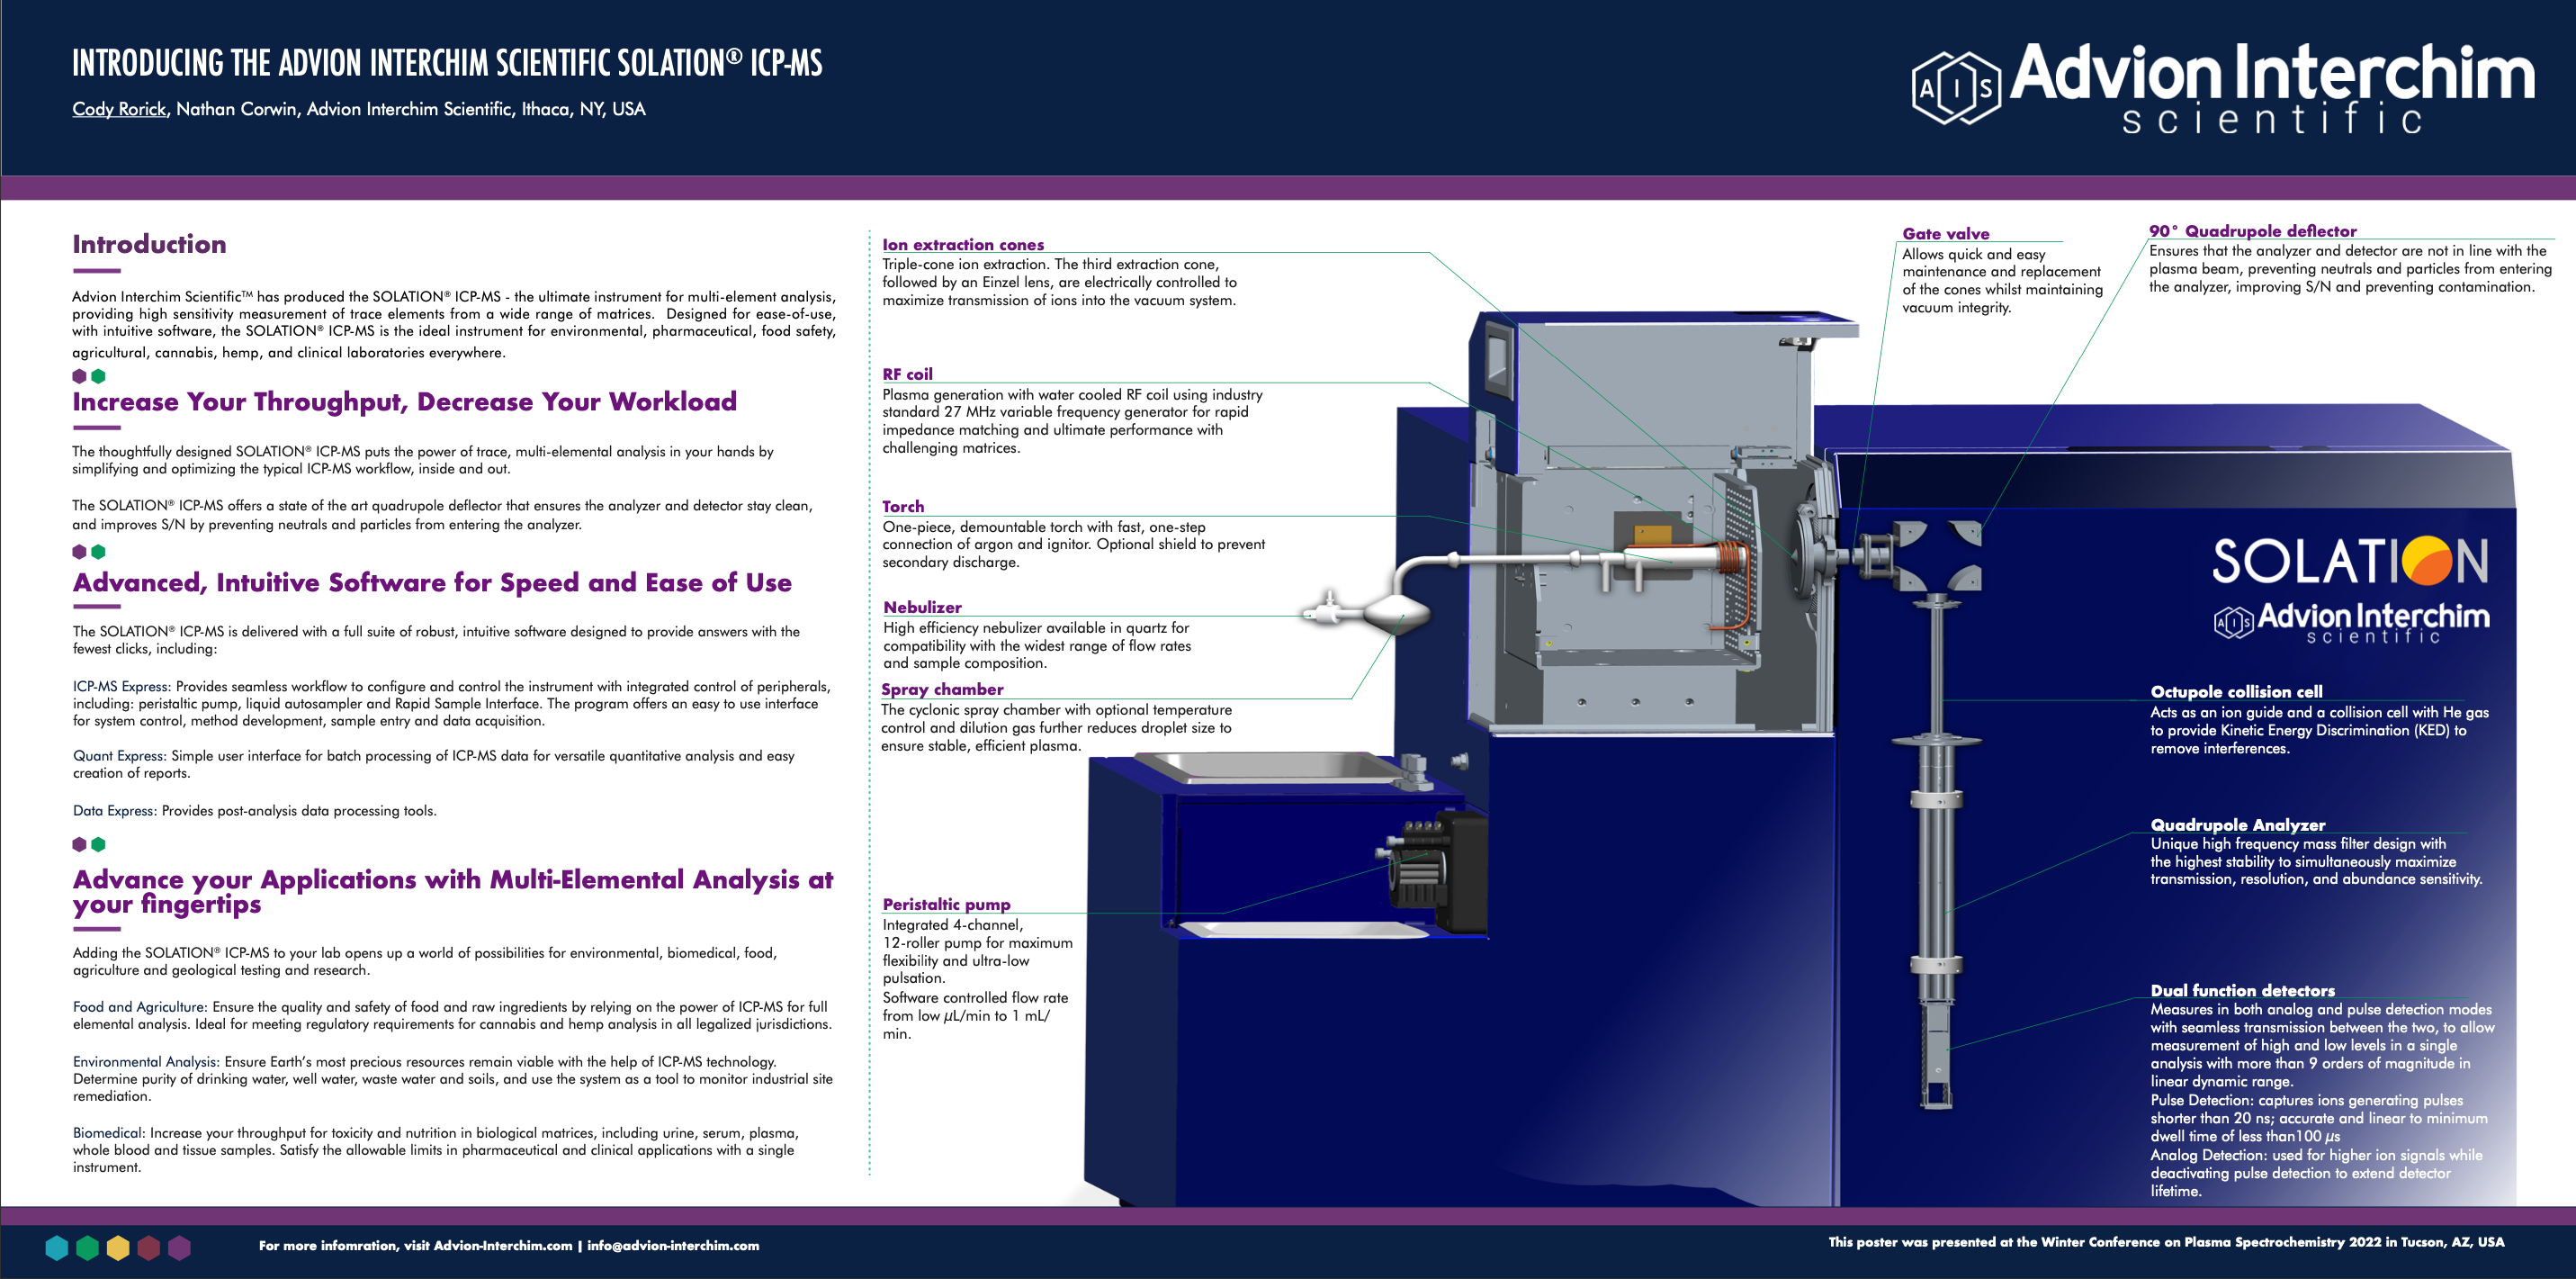
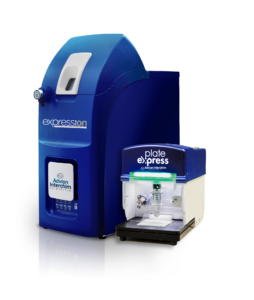
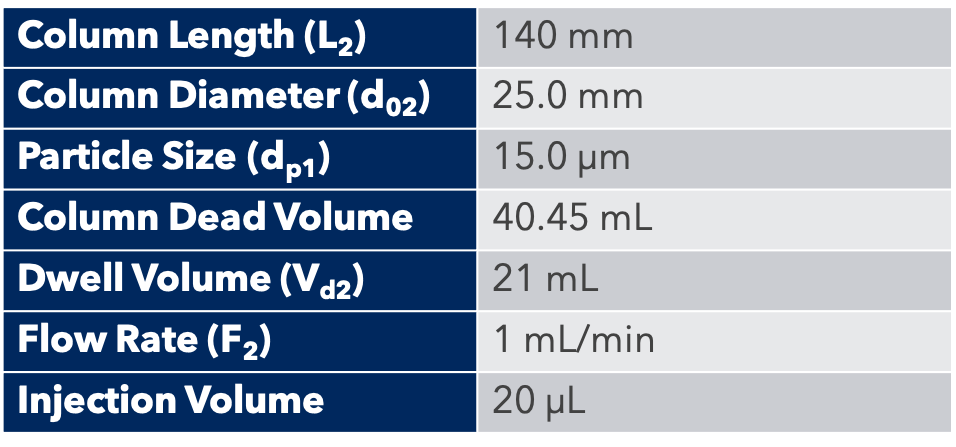
Instrumentation: SOLATION® ICP-MS

INTRODUCTION

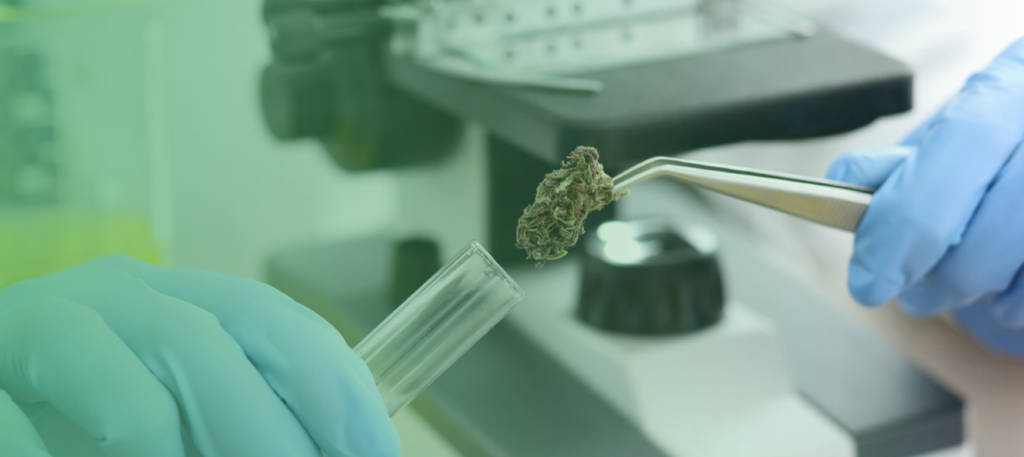
With the growing acceptance and legalization of hemp and cannabis in the US, Canada, and several other countries, cannabis products are more widely available than ever before. Now approved for medical, recreational and health supplement uses, increased production and consumption have highlighted the need for routine testing and development of testing standards for toxic chemicals, including heavy metals, in cannabis plant material, and all the byproducts made from them, to ensure safe products for the consumer.  With the adoption of chapters <232> and <233>, US Pharmacopeia (USP) specifies a list of elements and maximum exposure limits based on toxicity and routes of administration for pharmaceutical products.  

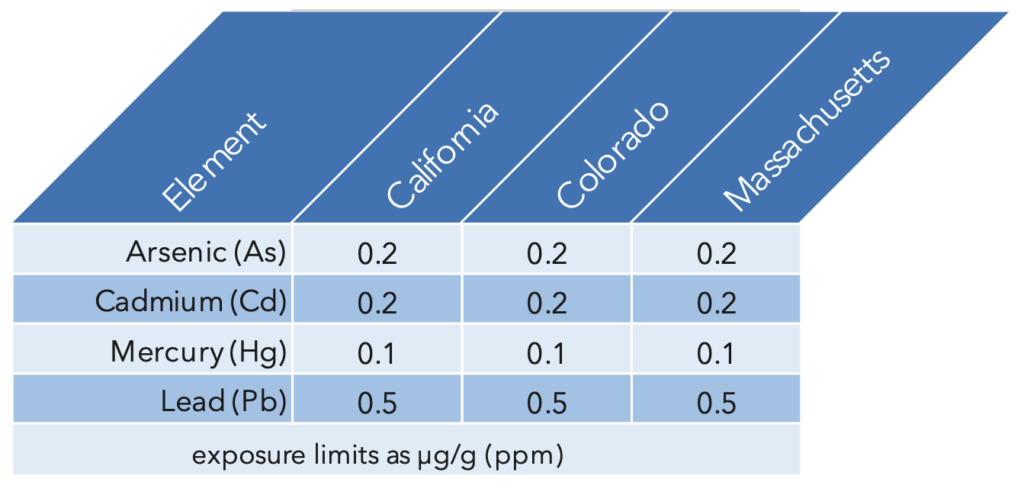
Many states that have legalized medical and recreational cannabis base their exposure limits on the USP values.  California, Colorado, and Massachusetts are examples with Permissible Daily Exposure (PDE) limits by inhalation for As, Cd, Hg, and Pb. These values are summarized in Table 1. 

Table 1: PDE limits for states that use the USP guidelines for heavy metal exposure by inhalation. USP<233> also defines the accuracy, repeatability, and ruggedness required for the analysis of these toxic elements:

Validation Criteria

Accuracy: The matrix and materials under investigation must be spiked with target elements at concentrations that are 50%, 100%, and 150% of the maximum permitted daily exposure (PDE). Mean spike recoveries for each target element must be within 70%-150% of the actual.

Repeatability: Six independent samples of the material under investigation must be spiked at 100% of the target limits defined and analyzed. The measured percent relative standard deviation (%RSD) must not exceed 20% for each target element.

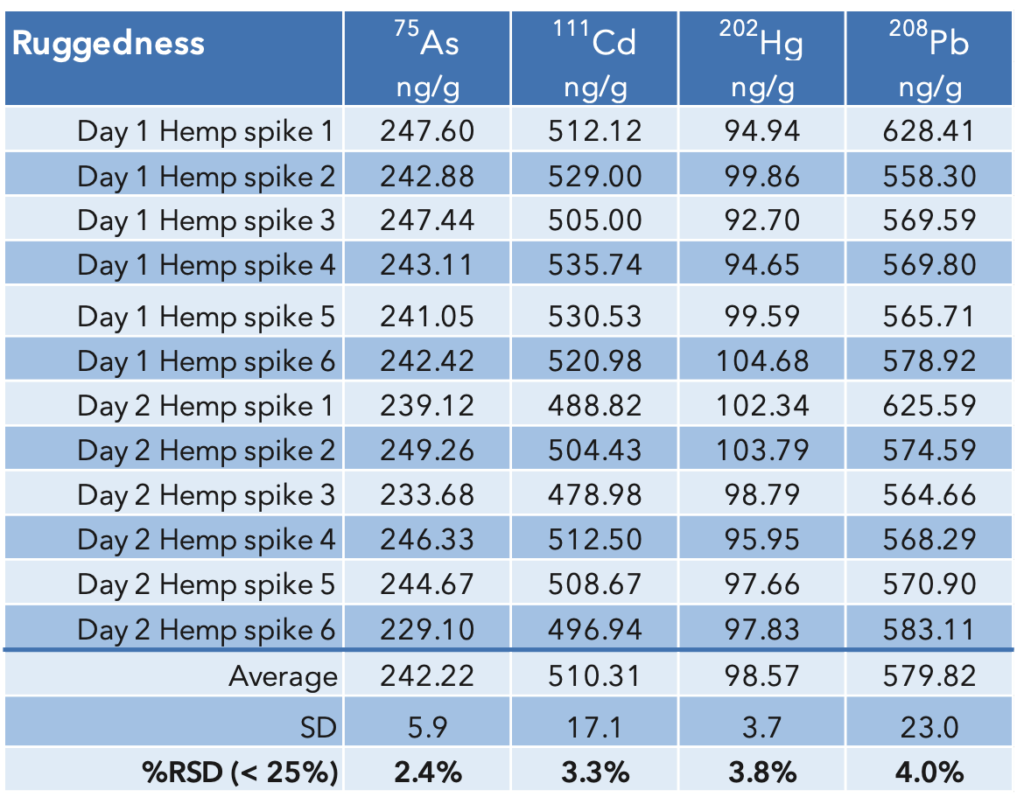
Ruggedness: Carrying out the repeatability measurement testing procedure by analyzing the six repeatability test solutions either on different days, either with a different instrument or by a different analyst. The %RSD of the 12 replicates must be less than 25% for each target element.

In this study, we used the Advion SOLATION® ICP-MS and a microwave digestion system to digest and analyze hemp samples using the validation methods described in USP General Chapter <233>.  The sensitivity, ability to handle complex matrices, and the ability to remove interferences with a helium collision cell makes this the ideal system for heavy metal analysis in the cannabis industry.

EXPERIMENT

Sample Preparation

A sample of medicinal hemp flower was purchased locally.  Around 14 grams was finely ground and homogenized, then 0.5g +/- 0.005g was weighed into digestion vessels and the appropriate amount of a spike solution added.  Nine mL of concentrated HNO3 and 1 mL concentrated HCl was added to each vessel and the samples were allowed to react for 15 minutes prior to sealing and placing the vessels on the turntable of the closed vessel microwave digestion system.  The program controls the microwave energy such that the samples ramped up to the optimal digestion temperature of 200°C over 20 minutes, maintained 200°C for 10 minutes, and then cooled back to room temperature.  

This method resulted in the complete digestion of all samples resulting in a clear, particulate-free solution once brought to volume with 18MΩ water in a 50mL volumetric flask.

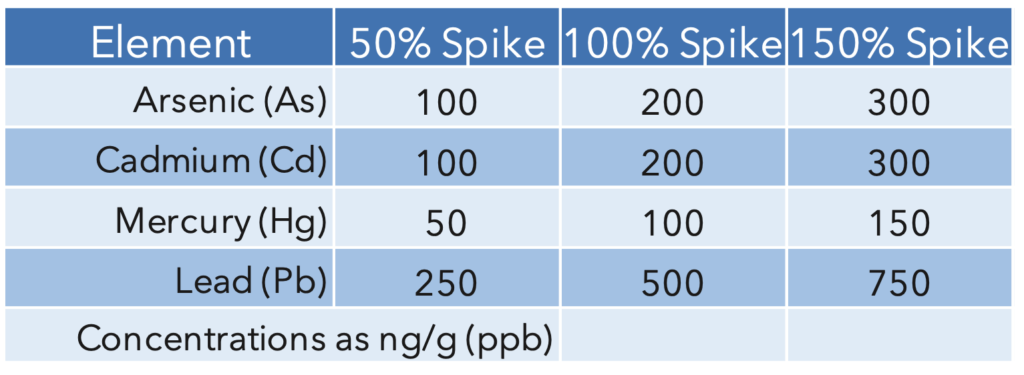
The calibration standards and spikes were based on the action levels in table 1.  The sample set included a hemp sample, a duplicate, the 50%, 100%, and 150% spikes, and NIST 1575 Pine needles to further validate the results, which were run in duplicate.  For the ‘ruggedness’ specification from USP<233>, there were 6 samples of the 100% spiked hemp.  The spike values are summarized in Table 2.

Table 2: Spike values based on the action limits defined in USP<233>

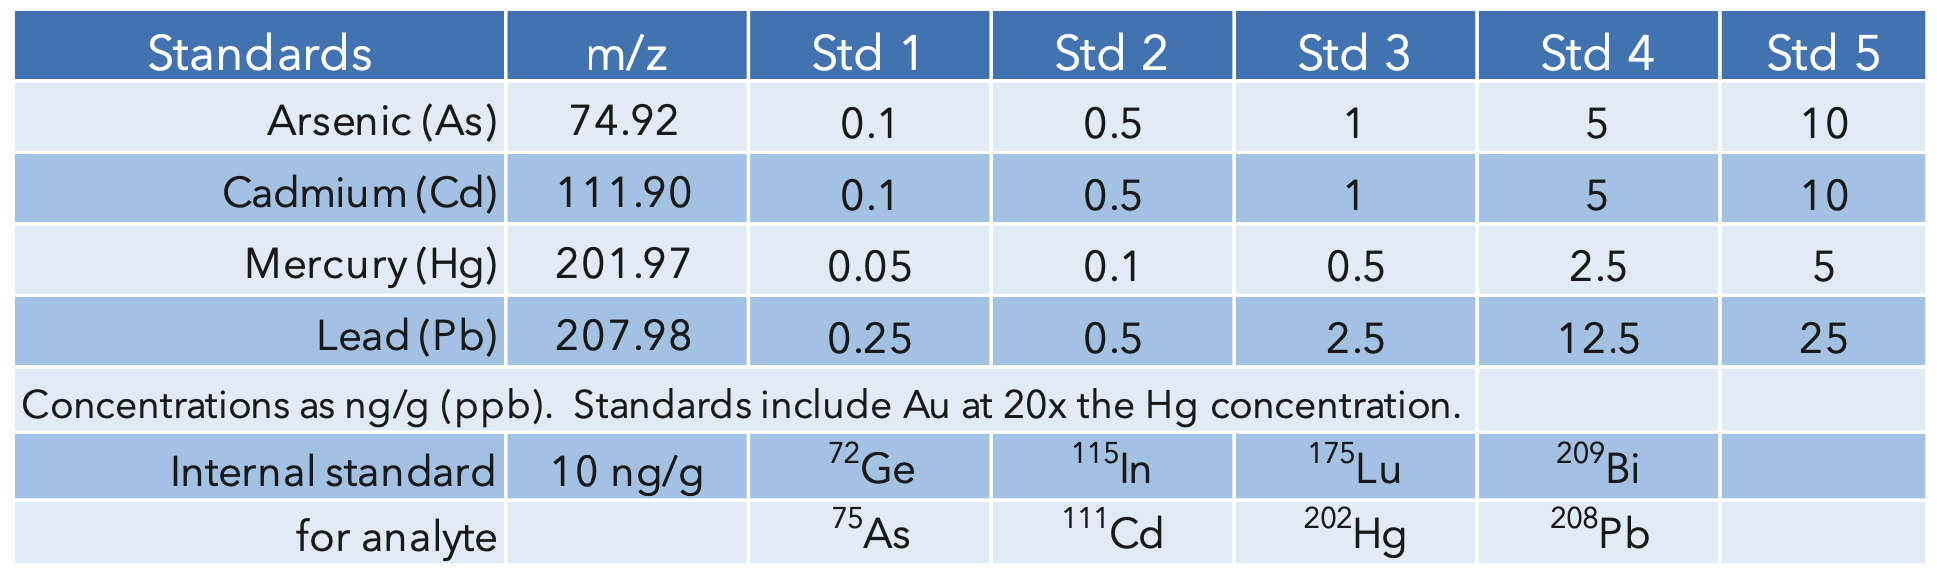
A second, 1:4 dilution was performed post digestion to bring the final acid concentration to 5% for an overall dilution factor of 400x.  The calibration blank and standards were prepared using the same acid concentration, 5% of 9:1 HNO3/HCl, for matrix matching.  To stabilize mercury and help with wash-out, Gold was added at 20x the mercury concentration.  The internal standards were added to all the samples, standards and blank for a final concentration of 10 ng/g (ppb).  The standard concentrations and internal standards are summarized in Table 3.

Table 3: Analyte masses, calibration standards, and internal standards.
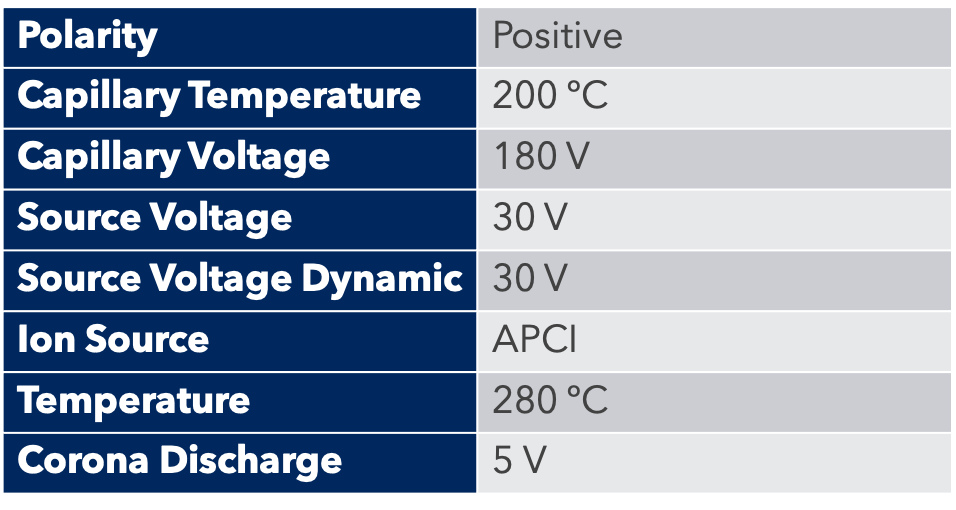
Instrumentation

The Advion SOLATION® ICP-MS incorporates a robust solid-state generator, orthogonal ion optics for keeping the most sensitive components of MS clean, and easy-to-use control and data processing software. 

Since HCl was used in the sample digestion, there is a significant amount of chlorine present which creates an isobaric interference on 75As from 40Ar35Cl+.  The collision cell effectively eliminates the contribution that ArCl+ makes to the signal at m/z 75 by taking advantage of kinetic energy discrimination (KED) to separate polyatomic interferences from analyte ions resulting in accurate quantitation of low levels of Arsenic.  Arsenic is the only analyte in the suite with this type of interference, so the collision cell isn’t used for Cd, Hg, or Pb.  

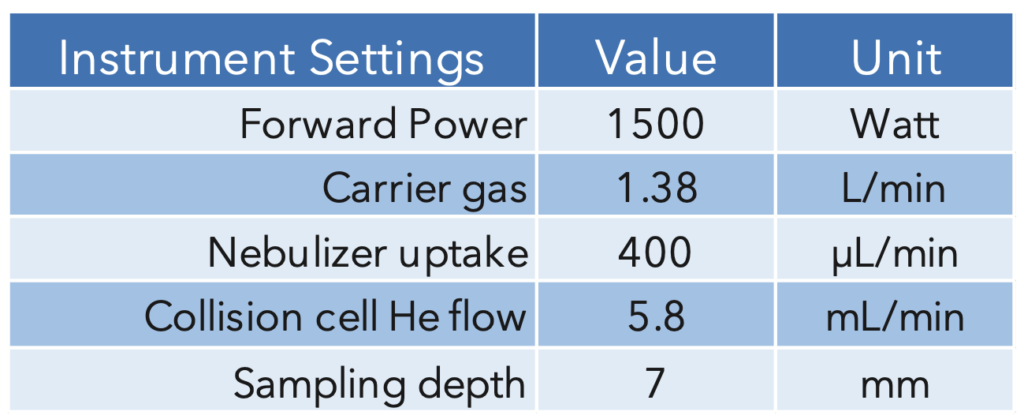
A glass concentric nebulizer fitted to a cyclonic spray chamber, connected to the standard torch with an injector ID of 2mm, was used for sample introduction.  Instrument running parameters are summarized in Table 4.

Table 4: ICP-MS Parameters

RESULTS AND VALIDATION
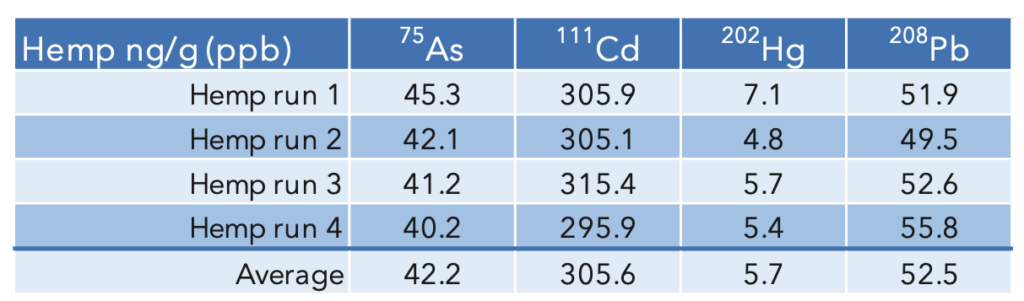
Sample Results

The concentrations of mercury and lead in hemp were less than the lowest standard and all values were less than the action limits. The samples were prepared and analyzed in duplicate, and the average of those duplicates is shown in Table 5. In keeping with the ruggedness requirement, the samples were run on separate days by two different analysts.

Table 5: Hemp sample results (average of the sample and duplicate)

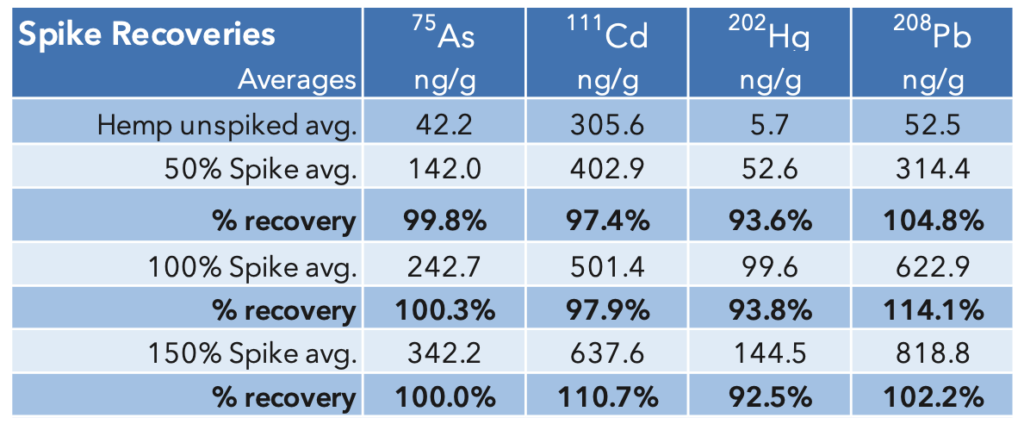
Accuracy: The samples were spiked at 50%, 100%, and
150% of the action level (Table 2 above) and the percent recoveries calculated. Spike recoveries were all between 92.5% – 114.1%, well within the 70-150% range defined by the USP method.

Table 6: Accuracy- Spike recoveries

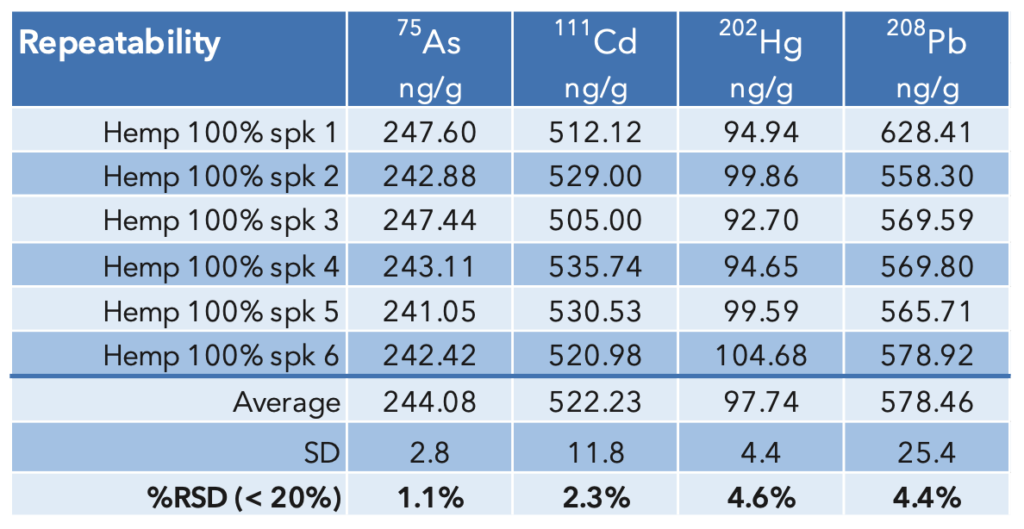
Repeatability: Six hemp samples were spiked at 100% of the action level and digested. The results that are summarized in Table 7 show that the %RSD of the measured concentrations are between 1.3% – 3.7%, demonstrating repeatability well below the 20% limit.

Table 7: USP<233> Repeatability results

Ruggedness: The repeatability sample set was prepared and run on a different day by a different analyst. The results from that run are combined with the previous run to determine the ruggedness. The ruggedness values are similar to the repeatability values and the measured %RSD (2.4 – 4.0%) are comfortably under the 25% limit defined by the USP method. The results are summarized in Table 8.

Table 8: USP<233> Ruggedness results
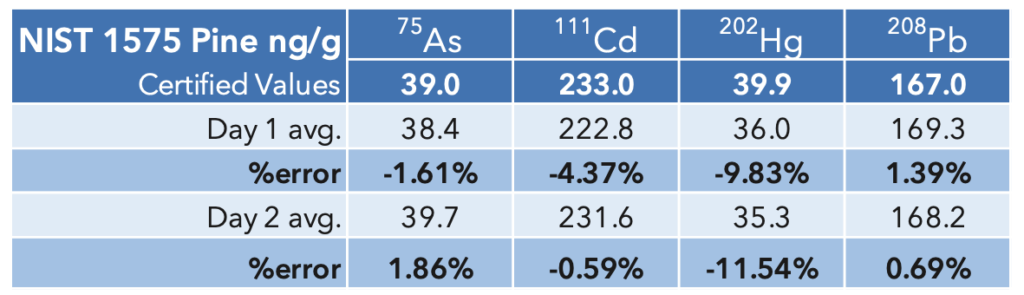
NIST 1575a Results

The results for the NIST SRM are summarized in Table 9. The values for As and Hg were less than
the low standard in solution but there is good agreement between the experimental values and the certified values.

Table 9: NIST 1575a Pine Needles SRM

CONCLUSION

This study demonstrates that the Advion SOLATION® ICP-MS , coupled with a microwave digestion system, is suitable for the accurate, robust and reproducible analysis of heavy metals in hemp plant material – greatly exceeding the requirements of USP <233> protocol.

Validation of the microwave digestion method was reinforced by the excellent recovery results obtained for the NIST SRM 1575 Pine.

Direct Sample Analysis of Fizzy Drinks Without Sample Preparation on a Compact Mass Spectrometer

Mass Spec: expression® CMS
Sampling: ASAP

INTRODUCTION

Chemists are tasked with quickly identifying compounds created, ensuring quality of products, or evaluating safety. Current techniques are adequate, but not all offer the speed, data quality, or ease-of-use provided by the Advion expression® CMS. The CMS with the Advion ASAP offers chemists the ability to rapidly analyze solids, liquids and powders without tedious and time consuming sample preparation.

METHOD

The extended glass capillary of the ASAP was dipped into each fizzy drink sample. The excess was wiped off and the probe was inserted directly into the ASAP-enabled APCI ion source of the CMS, producing results in seconds.

Figure 1: The ASAP containing the sample directly inserted into the ASAP-enabled APCI source of the CMS for analysis.

Figure 2: Schematic of the ASAP sampling probe for APCI-CMS analysis.

RESULTS

SUMMARY

The ASAP/CMS analysis provided data in < 1 min with no sample preparation and no chromatography, making it ideal for reaction monitoring, compound identification, food safety, and analysis of natural products.

Classifying Cheeses by Volatile APCI (vAPCI) Compact Mass Spectrometry

Mass Spec: expression® CMS
Sampling: vAPCI

INTRODUCTION

Cheese is one of the world’s most popular food types, with a wide variety available for consumers. We commonly eat cheeses from cows, goats, and sheep. The scents and flavors of cheeses, so characteristic to each type of cheese, stem from a complex mixture of chemicals, including free fatty acids. While this mixture is affected by a wide variety of factors we can use the mass spectra to characterize the volatile profiles of different types of cheeses.

Figure 1: (A) Goat cheese, (B) Blue Stilton,  (C) Red Leicester, (D) Wensleydale.
page2image34720496
Figure 2: Schematic of the vAPCI source inlet system.

In this application note, we demonstrate the capability of the Advion expression® CMS to analyze volatile fatty acids of various types of cheeses using our volatile APCI (vAPCI) ion source. By heating the cheese samples, we released various volatile compounds, mainly fatty acids, and analyzed the headspace without any sample preparation or derivatization. We then performed statistical analysis to group the cheese samples by their different volatile profiles.


METHODS

Several cheeses of different types were warmed in vessels to 70°C for 2 hours, and the headspaces of the vessels were analyzed using the CMS with a vAPCI ion source, using solvent flow (10 mM4NH4OAc in 1:1 MeOH:H2O) to aid in ionization.

While the cheese samples contained many of the same fatty acids, ions invisible to the naked eye will provide the required information to separate the profiles for each cheese. To look for these differences we performed principle component analysis (PCA) on the mass spectra.

page2image34616112

Figure 3: A selection of fatty acids commonly found in different cheese.

RESULTS AND DISCUSSION

The mass spectra show that a wide variety of fatty acids evolve from each of the cheese samples when warmed (Figure 3). Each cheese sample contained many of the same fatty acids (Table 1).

page3image34665600

Figure 4: Mass spectra of representative samples of four types of cheese: (A) Goat Cheese, (B) Blue Stilton, (C) Red Leicester, and (D) Wensleydale.

Table 1: Fatty acids observed using vAPCI analysis of cheese samples.

PCA is a statistical tool that is used to look for patterns in data. The resulting plot (Figure 6) shows grouping based on how similar or different samples are from each other. By performing PCA on the data from several samples of each type of cheese, we found that the different cheeses indeed can each be grouped together based on their mass spectra allowing rapid identification using vAPCI analysis. For example, the various goat cheeses had statistically similar spectra and are thus grouped together on the PCA plot. This is generally true of each type of cheese.

page3image34857840

Figure 6: PCA of cheese volatile profiles.

The mass spectra of each type of cheese were characteristic; not only were the spectra for cheese samples similar within each type of cheese, but they were substantially different between the different types of cheeses analyzed.

CONCLUSIONS

We used the Advion expression® CMS with a vAPCI ion source to analyze the fatty acids in vapor given off by warmed cheese samples without any additional sample preparation or derivatization. Additionally, we used PCA to show that the spectra of each type of cheese is characteristic to that type of cheese, which allows us to classify the different cheese samples by their type. This would further allow us to identify cheeses by their type using a simple volatile mass spectrometry set up.

Analysis of Volatile Compounds in the Fermentation of Beer

Mass Spec: expression® CMS
Sampling: vAPCI

INTRODUCTION

The chemical analysis of alcoholic beverages is an important step in quality control, being used to monitor flavour profiles across batches, study chemical changes in the product over time, and identify the source of any problems (e.g. off flavours).

The complex flavour of beer is primarily a result of the ingredients used, the brewing method, and conditions during fermentation, and the analysis of beer throughout this process can be invaluable in monitoring fermentation and establishing the point at which problems occur. Being one of the most widely consumed beverages worldwide, rapid and reliable analytical techniques are essential to keep up with demand and production.

Gas or liquid chromatography-mass spectrometry (GC/MS or LC/MS, respectively) are traditionally utilised for quality control in the spirit and beverage industry; however, these techniques can be relatively time-consuming and not necessarily ideal for rapid, high-throughput analysis.

METHOD

Figure 1: Advion expression® CMS with vAPCI heat transfer line.page2image34676944

Figure 2: Schematic of vAPCI/CMS.

page2image34670000 page2image66303488

Aliquots of the homebrew (1 mL) were collected and analysed 12 hours, 4 days, and 14 days into the fermentation process, in addition to mosaic hop leaves (1 g). The homebrew also contained simcoe and citra hops, which were not analysed.

Each aliquot was sealed in a glass vial and heated to 70oC for 10 minutes. The headspace was drawn directly into the CMS by the Venturi Effect of the vAPCI source for analysis. Samples were analysed in positive ion mode over a range of 30-300 m/z, with a scan time of 400 ms.

RESULTS AND DISCUSSION

Figure 3: Mass spectra of homebrew headspace at (A) 12 hours, (B) 4 days, and (C) 14 days) into fermentation.

page3image35400304

There were distinct changes in the overall volatile profile, notably the gradual increase in the m/z 93 ion, likely the protonated ethanol dimer (Figure 3). The concentration of this ion plateaus at the 4 day timepoint, demonstrating fermentation primarily occurred in the first few days.

Figure 4: Mass spectrum of mosaic hops, added 4 days into fermentation.

page3image35394816

The headspace of mosaic hops used in in this homebrew were also analysed. The hops mass spectrum (Figure 4) was dominated by ions at m/z 81, 137 and 273, all of which are common ions associated with terpenes, a class of compounds responsible for many of the aromas and flavours of hops. Many of these compounds are of the same molecular weights and thus further analysis would be required to differentiate and identify these components. Components derived from hops are readily detected in the beer aliquots, particularly after the 4 day timepoint, when additional hops were added.

CONCLUSIONS

This study demonstrates the use of the Advion expression® CMS with vAPCI for the analysis of volatile compounds from the headspace of home-brew beer and hops. The Venturi-assisted interface of the instrument enabled rapid sampling of volatiles, allowing the changing volatile profile of the homebrew to be observed throughout the fermentation process. This simple method would be suitable for fast quality control during alcoholic beverage production.

Mistletoe: Kiss of Love or Death? Using Thin Layer Chromatography with Compact Mass Spectrometry

Mistletoe

Mass Spec: expression® CMS
Sampling: Plate Express™ 

 In the spirit of the Holiday season and to ensure that mistletoe kisses are enjoyed and are ‘non-toxic’, we employed the Advion Interchim Scientific expression® Compact Mass Spectrometer (CMS) and the Plate Express™ TLC Plate Reader to analyze a commercial Tincture of Mistletoe ethanolic extract to determine whether tyramine is present in the extract of mistletoe. 

INTRODUCTION 

A sprig of mistletoe symbolizes a tradition of romance (Figure 1), and has a legacy of folklore purporting that extracts of mistletoe can cure cancer along with a long list of other reported health benefits. However, mistletoe is also considered lethal. Reputed to be the “kiss of death”, mistletoe is said by some to be so poisonous that humans can be killed if they ingest the leaves or berries. 

Figure 1: The tradition of mistletoe.
Mistletoe

The reported toxicity made us wonder, why or how can vendors sell mistletoe extracts for purposeful human consumption? One species of mistletoe, Viscum, reportedly contains the poisonous alkaloid, tyramine, which can cause blurred vision, nausea, abdominal pain, diarrhea, blood pressure changes, and even death. A search of peer-reviewed scientific literature reveals a dearth of credible analytical support for the presence of tyramine in mistletoe. 

In the spirit of the Holiday season and to ensure that mistletoe kisses are enjoyed and are ‘non-toxic’, we employed the Advion Interchim Scientific TLC/CMS system (Figure 2) to analyze a commercial tincture of Mistletoe ethanolic extract to determine whether tyramine is present in the extract of mistletoe.

Figure 2: Experimental setup of the Advion Interchim Scientific expression® CMS with the Plate Express™ TLC Plate Reader.
CMS and Plate Express
Figure 3: Experimental herbs used.
Mistletoe herb

EXPERIMENTAL 

A tincture of mistletoe was purchased from Indigo Herbs. A small aliquot of this tincture sample was derivatized with dansyl chloride at 50 ºC for 30 min according to well-known procedures[1]. Similarly, an authentic sample of tyramine was derivatized in the same manner to form its dansyl derivative. 

A small aliquot (10 mL) of the standard tyramine dansyl derivative was applied to the outside lanes (Lanes 1 and 4) of a Merck Silica gel G TLC plate. An aliquot of the derivatized tincture of mistletoe was applied to Lane 2 and a derivatized tincture of mistletoe spiked with tyramine dansyl derivative was applied to Lane 3 (Figure 4). 

Figure 4: TLC plate after development and visualization under long wavelength UV light. Lanes 1 and 4: Dansyl derivative of standard tyramine. Lane 2: Dansyl derivative reaction mixture of mistletoe tincture sample. Lane 3: Tincture extract dansyl derivative with standard tyramine dansyl derivative spiked into it. (A) Rf=0.3 for tyramine dansyl derivative. (B) Rf=0.6 for dansyl chloride.
Mistletoe Results

The air-dried TLC plate was developed in an equilibrated solvent tank containing chloroform/ethyl (8/2, v/v) acetate. The developed TLC plate was then viewed under long wavelength UV light to reveal the separated components (Figure 3). The TLC plate was positioned onto the Plate Express™ TLC Plate Reader whereupon each TLC ‘spot’ could be individually analyzed by TLC/CMS. 

With reference to Figure 4, the TLC/CMS analysis readily showed that the Rf 0.3 spots in the two outside lanes (Lanes 1 and 4) produced a mass spectrum with an abundant m/z 371 consistent with the expected protonated molecule of the tyramine dansyl derivative (Figure 5A). The TLC/CMS mass spectra obtained from the spots with an Rf=0.6 observed in Lanes 1 and 4 were consistent with unreacted dansyl chloride with a protonated molecule at m/z 270 (data not shown). TLC/CMS analysis of the spot in lane 2 at Rf=0.3 showed no evidence for the presence of tyramine dansyl derivative (Figure 5B). 

Figure 5: (A) TLC/CMS mass spectrum of standard tyramine dansyl derivative observed at Rf=0.3 in Figure 4 Lane 1. (B) LC/CMS mass spectrum of derivatized tincture of mistletoe observed at Rf=0.3 in Figure 4 Lane 2. 

Mistletoe Spectra

In the absence of TLC/CMS analysis, it would be logical to conclude the spot at Rf=0.3 in lane 2 was due to the presence of tyramine in the mistletoe tincture sample. The Rf=0.3 spot observed for the fortified tincture extract in Lane 3 of Figure 4 readily showed the same mass spectrum for tyramine dansyl derivative that is shown in Figure 5A. The same negative results for tyramine were obtained from the alcohol extract of the mistletoe leaf product. 

CONCLUSIONS 

The results from this brief study suggest either that the level of tyramine in the tincture sample is very low and below our detection limits or that tyramine is not present in the sample. It is common for synthetic and forensic chemists to employ TLC techniques as a quick, easy screen of a sample to determine the presence of an expected chemical. Comparison with a known sample, which shows the same Rf value, will often provide some confidence for reporting the presence of the expected compound. However, as this example suggests a similar Rf value does not guarantee confirmation of the spot identity when it has the same Rf value. As shown here, access to the direct analysis of the spot with the Advion Interchim Scientific expression® CMS can either corroborate the expected identification or, as in this case, suggest that the spot with the same Rf value is NOT the expected compound. These results may explain why the commercial mistletoe tincture samples are not harmful for medicinal purposes. So, what should you do? Mistletoe is not deadly. But it can be hazardous, so don’t eat it. Just ‘steal a kiss under it’! 

REFERENCES AND ACKNOWLEDGEMENT 

[1]Mullins, Donald E. and Eaton, John L. Quantitative high-performance thin-layer chromatography of dansyl derivatives of biogenic amines, Anal. Biochem., 1988, 172, (484-487). 

Thank you to Chief Elf, Nigel Sousou, Ph.D., for leading the sample analysis process. 

puriFlash-MS Targeted Isolation of Natural Products Under Normal Phase Conditions

Introduction

The improvement of analytical techniques and methodological tools plays an important role in the characterization and isolation of bioactive secondary metabolites in natural product research. Reverse-phase liquid chromatography-mass spectrometry (RP-LC-MS) is widely used for metabolite profiling of complex natural extracts at the analytical level and is increasingly being used for targeted MS isolation of biomarkers. Normal-phase chromatography (NP-LC) is well suited for the purification of polar secondary metabolites offering also some advantages compared to RP like low operating pressures and cheapest stationary phases.

NP-LC however is typically not well-suited for MS coupling. The potential of NP-LC-APCI-MS for metabolite purification at the preparative scale using generic separation methods has been investigated on an Advion X Interchim PuriFlash® – CMS system in view of its application for targeted MS isolation of lipophilic secondary metabolite. A mixture of three representative apolar natural products was used to optimize separation, splitting and MS ionization in conditions mimicking real isolation cases. Finally, successful isolation of the apolar constituents of the dichloromethane roots extract of Angelica archangelica was performed.

Rapid Isolation of a Representative Apolar Natural Product Mixture by Normal-Phase Flash-CMS

Purification of a Natural Products Mixture on 12 g and 25 g Normal Phase Flash Columns

Three commercially available standards (caryophyllene oxide, khellin, and alpha-santonin) were used to evaluate the applicability of the puriFlash-CMS system as a tool for rapid purification of lipophilic compounds from crude plant extracts.

The four chromatograms show the mixture profile at the preparative scale with rapid gradients on two column sizes with a good overlap of the UV and MS signals.

All parameters were carefully optimized for both separation and detection. Special care was taken to find ionization and splitting conditions that would provide good detection and

Flash-MS Guided Purification of a Given Compound

Scheme of the Post Column Makeup Pump Dilution

puriFlash-CMS System

Solvents from the normal phase are highly flammable for the APCI source and should be avoided because of the heating process.

Optimized post-column dilution was mandatory in order to have an efficient and safe ionization.  The solvent mixture when it reached the MS detector was at > 99% either ACN or MeOH.

APCI-MS detection with optimized splitting conditions and post-column elution of appropriate solvent was found robust and well suited for this type of purification.

Normal-Phase puriFlash-CMS Purification of Angelica archangelica Roots Extract

Analytical HPLC-UV

Analytical Scale:

Preparative Scale:

Flash Preparative UV-ELSD-MS

The roots of Angelica archangelica are rich in coumarin derivatives. MS-ELSD detection in addition to UV detection enabled the monitoring of secondary metabolites with no or weak chromophores and the selectivity of the MS was of great help for a precise collection of partially coeluting compounds.

Conclusion

Normal-phase flash purification represents an efficient strategy for a rational isolation of specific lipophilic biomarkers or bio-active compounds based on metabolite profiling results. MS-triggered fractionation and ELSD monitoring in addition to standard UV detection is a powerful tool for precise collection and to estimate the amount of separated compounds. MS is particularly useful for the specific collection of any given m/z in case of coelution that often occurs in crude extracts using high loading and low peak capacity chromatographic methodologies.

This fast and rational approach can be widely used for single step purifications and isolation of synthetic and natural mixtures. It is also compatible for the detection of apolar compounds that lack chromophores which is very common in natural product research. Separation performed at the preparative scale allows to purify tens to hundreds mg of compounds for further structural identification and assessment of their bioactivities.

References

Davide Righi1, Antonio Azzollini1, Emerson Ferreira Queiroz1, Jean-Luc Wolfender1
School of pharmaceutical sciences, University of Geneva, University of Lausanne, 30 Quai Ernest-Ansermet, 1211 Geneva 4, Switzerland
[1] Davy Guillarme, Dao T.T. Nguyen, Serge Rudaz, Jean-Luc Veuthey, Eur. J. Pharma. Biopharma. 2008, 68, 430

Peptide Purification: Flash-MS Coupling using the puriFlash 5.250P and expression CMS

In order to adapt, Interchim set up a laboratory to be able to perform online demonstrations. These demonstrations can be articulated around purifications of “standard” products in order to demonstrate the potential of our instruments. This example demonstrates the capabilities of a flash-ms system featuring the Interchim puriFlash 5.250 and Advion expression Compact Mass Spectrometer (CMS) for the purification of a peptide.

Installation

For the purification of a peptide resulting from chemical synthesis, we used the puriFlash 5.250P. To monitor this purification, we used a UV detector and Advion expression CMS.

The detection of peptides by mass spectrometry is done with an ESI source, which is ideal for the detection of large molecules such as peptides. A small amount of product is “diverted” by the MS interface for detection.

Flow Injection Analysis (FIA)

Direct Injection of Crude Sample on the expression CMS.

Here is the resulting mass spectra:

We observe a peak at m/z 643, which corresponds to the molecule of interested charged 3 times (M+3H)3+, as well as a peak at m/z 964.3, which corresponds to the molecule of interest charged 2 times (M+2H)2+.

HPLC Conditions


Here are the results:

Transposition & Purification

A peptide column with a preparative column was used: PFB5C18T-150/212.

First, the analytical HPLC method was transposed to a preparative HPLC method.

Then, the concentration of the injected sample was increased to be able to purify the maximum amount of the product in a single run.

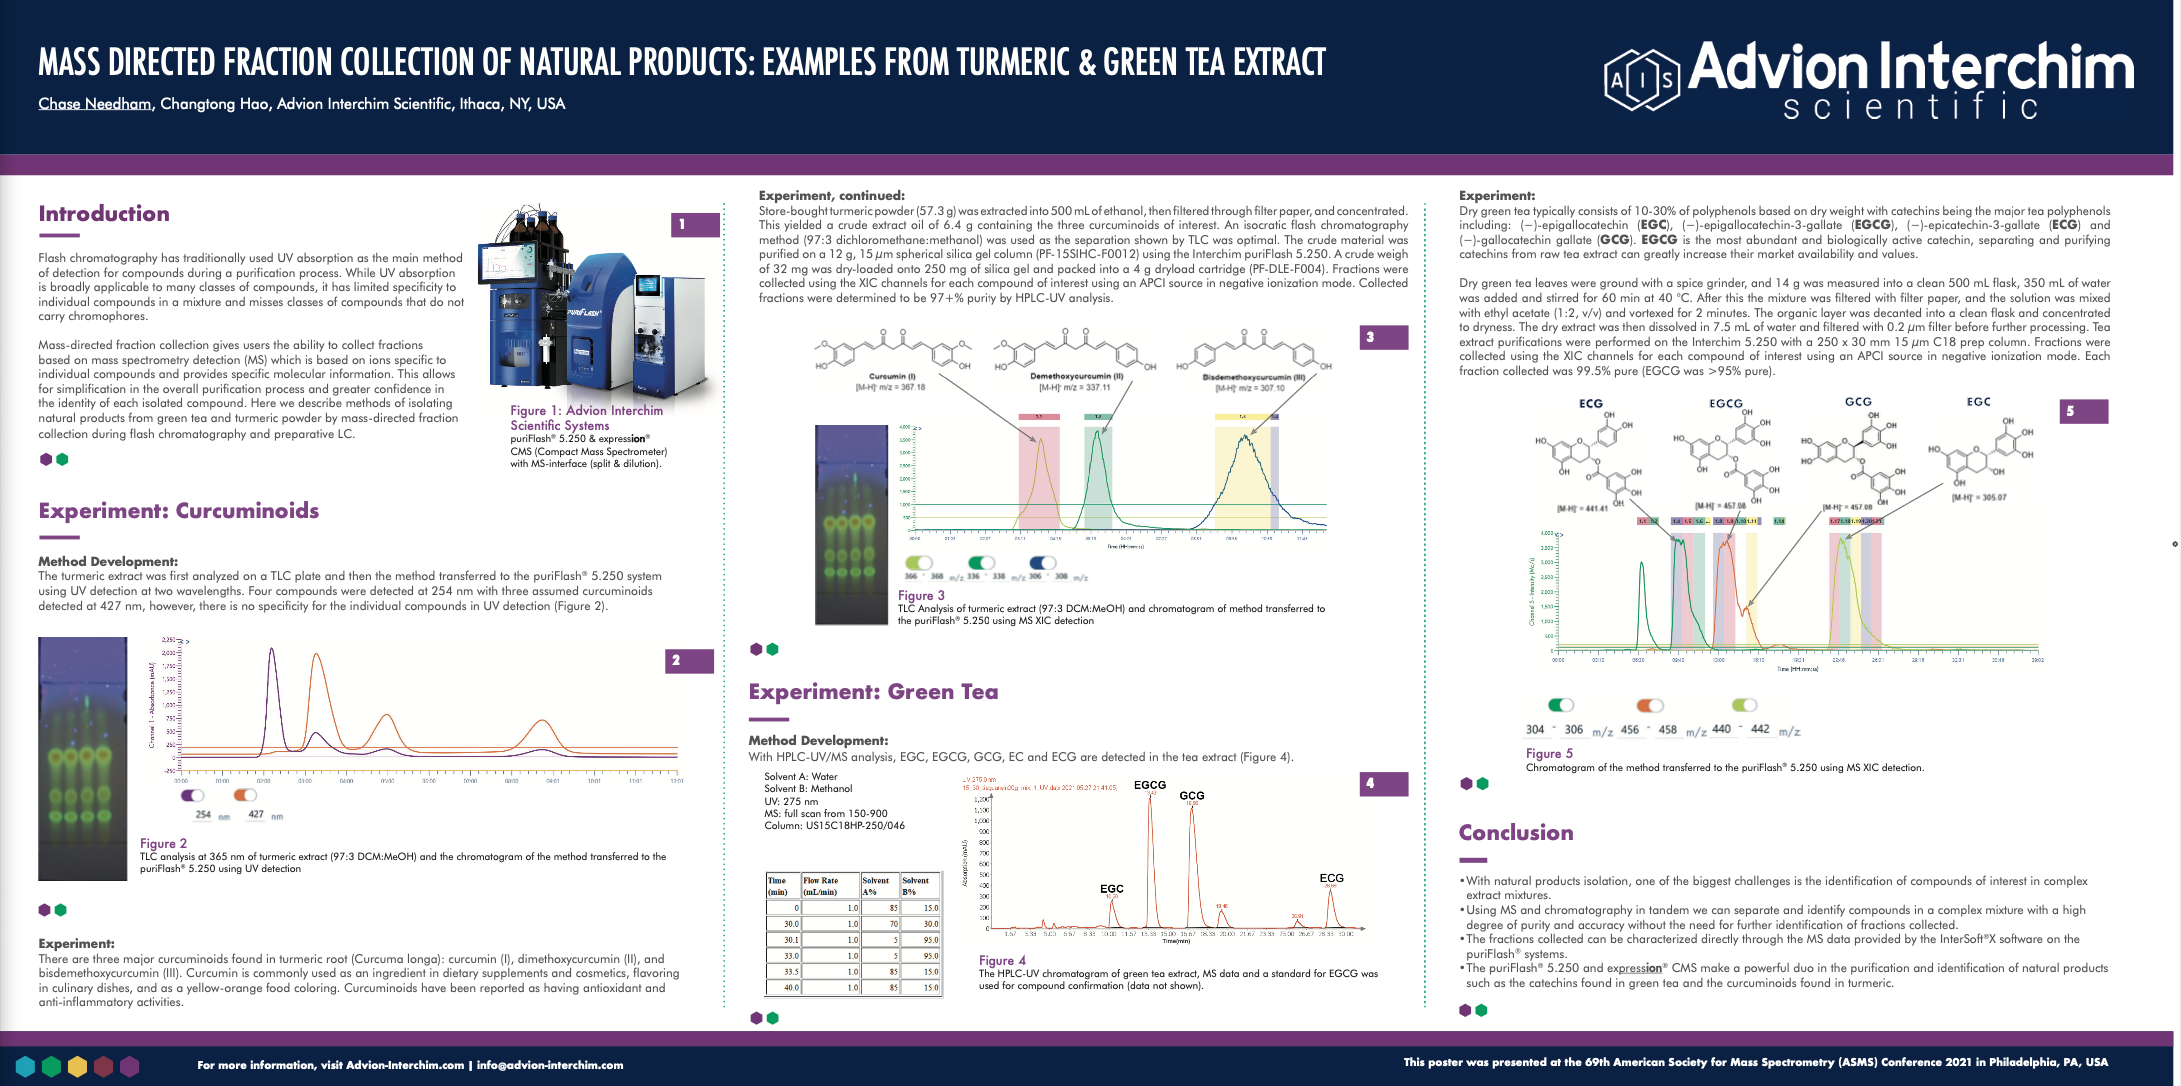
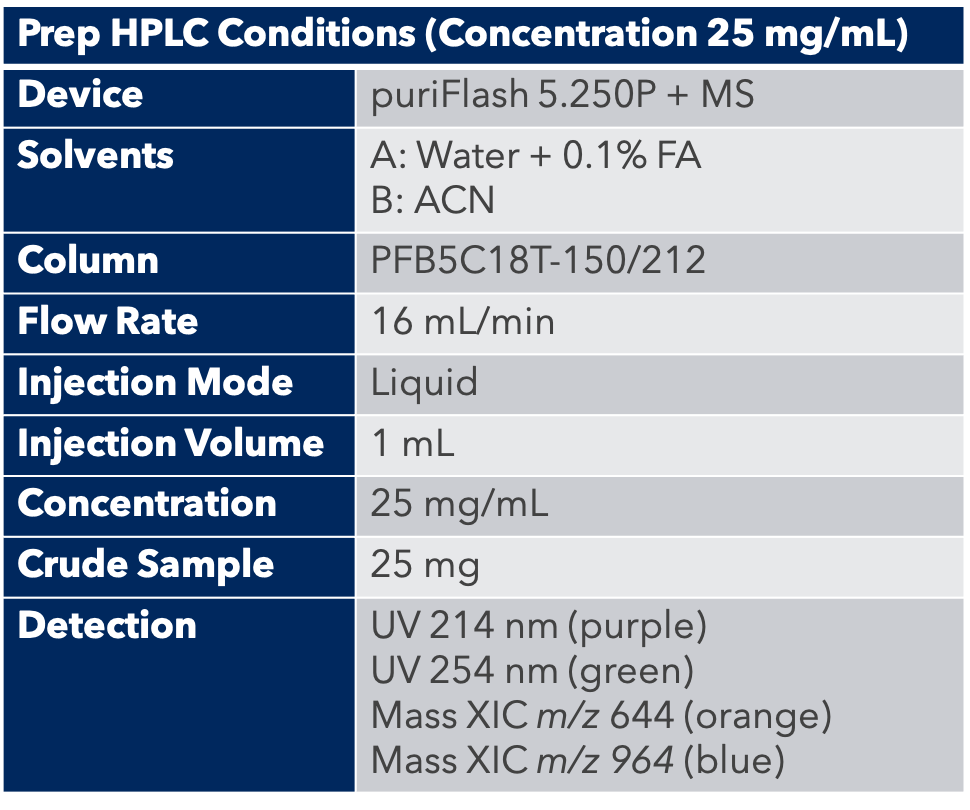
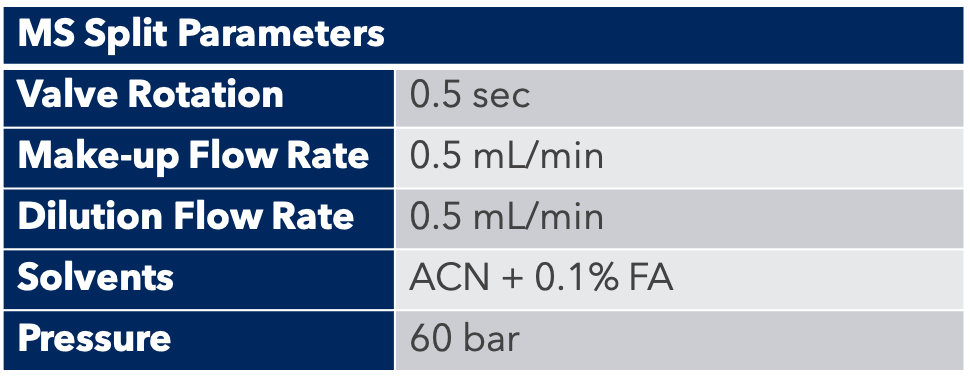
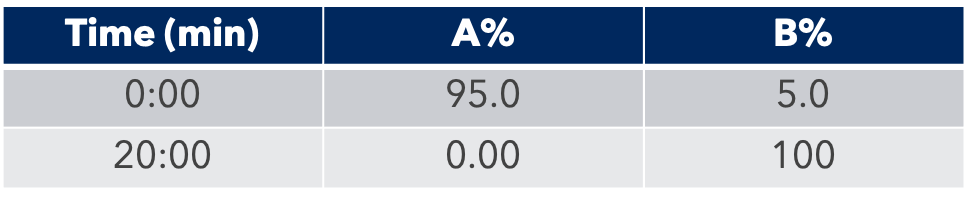
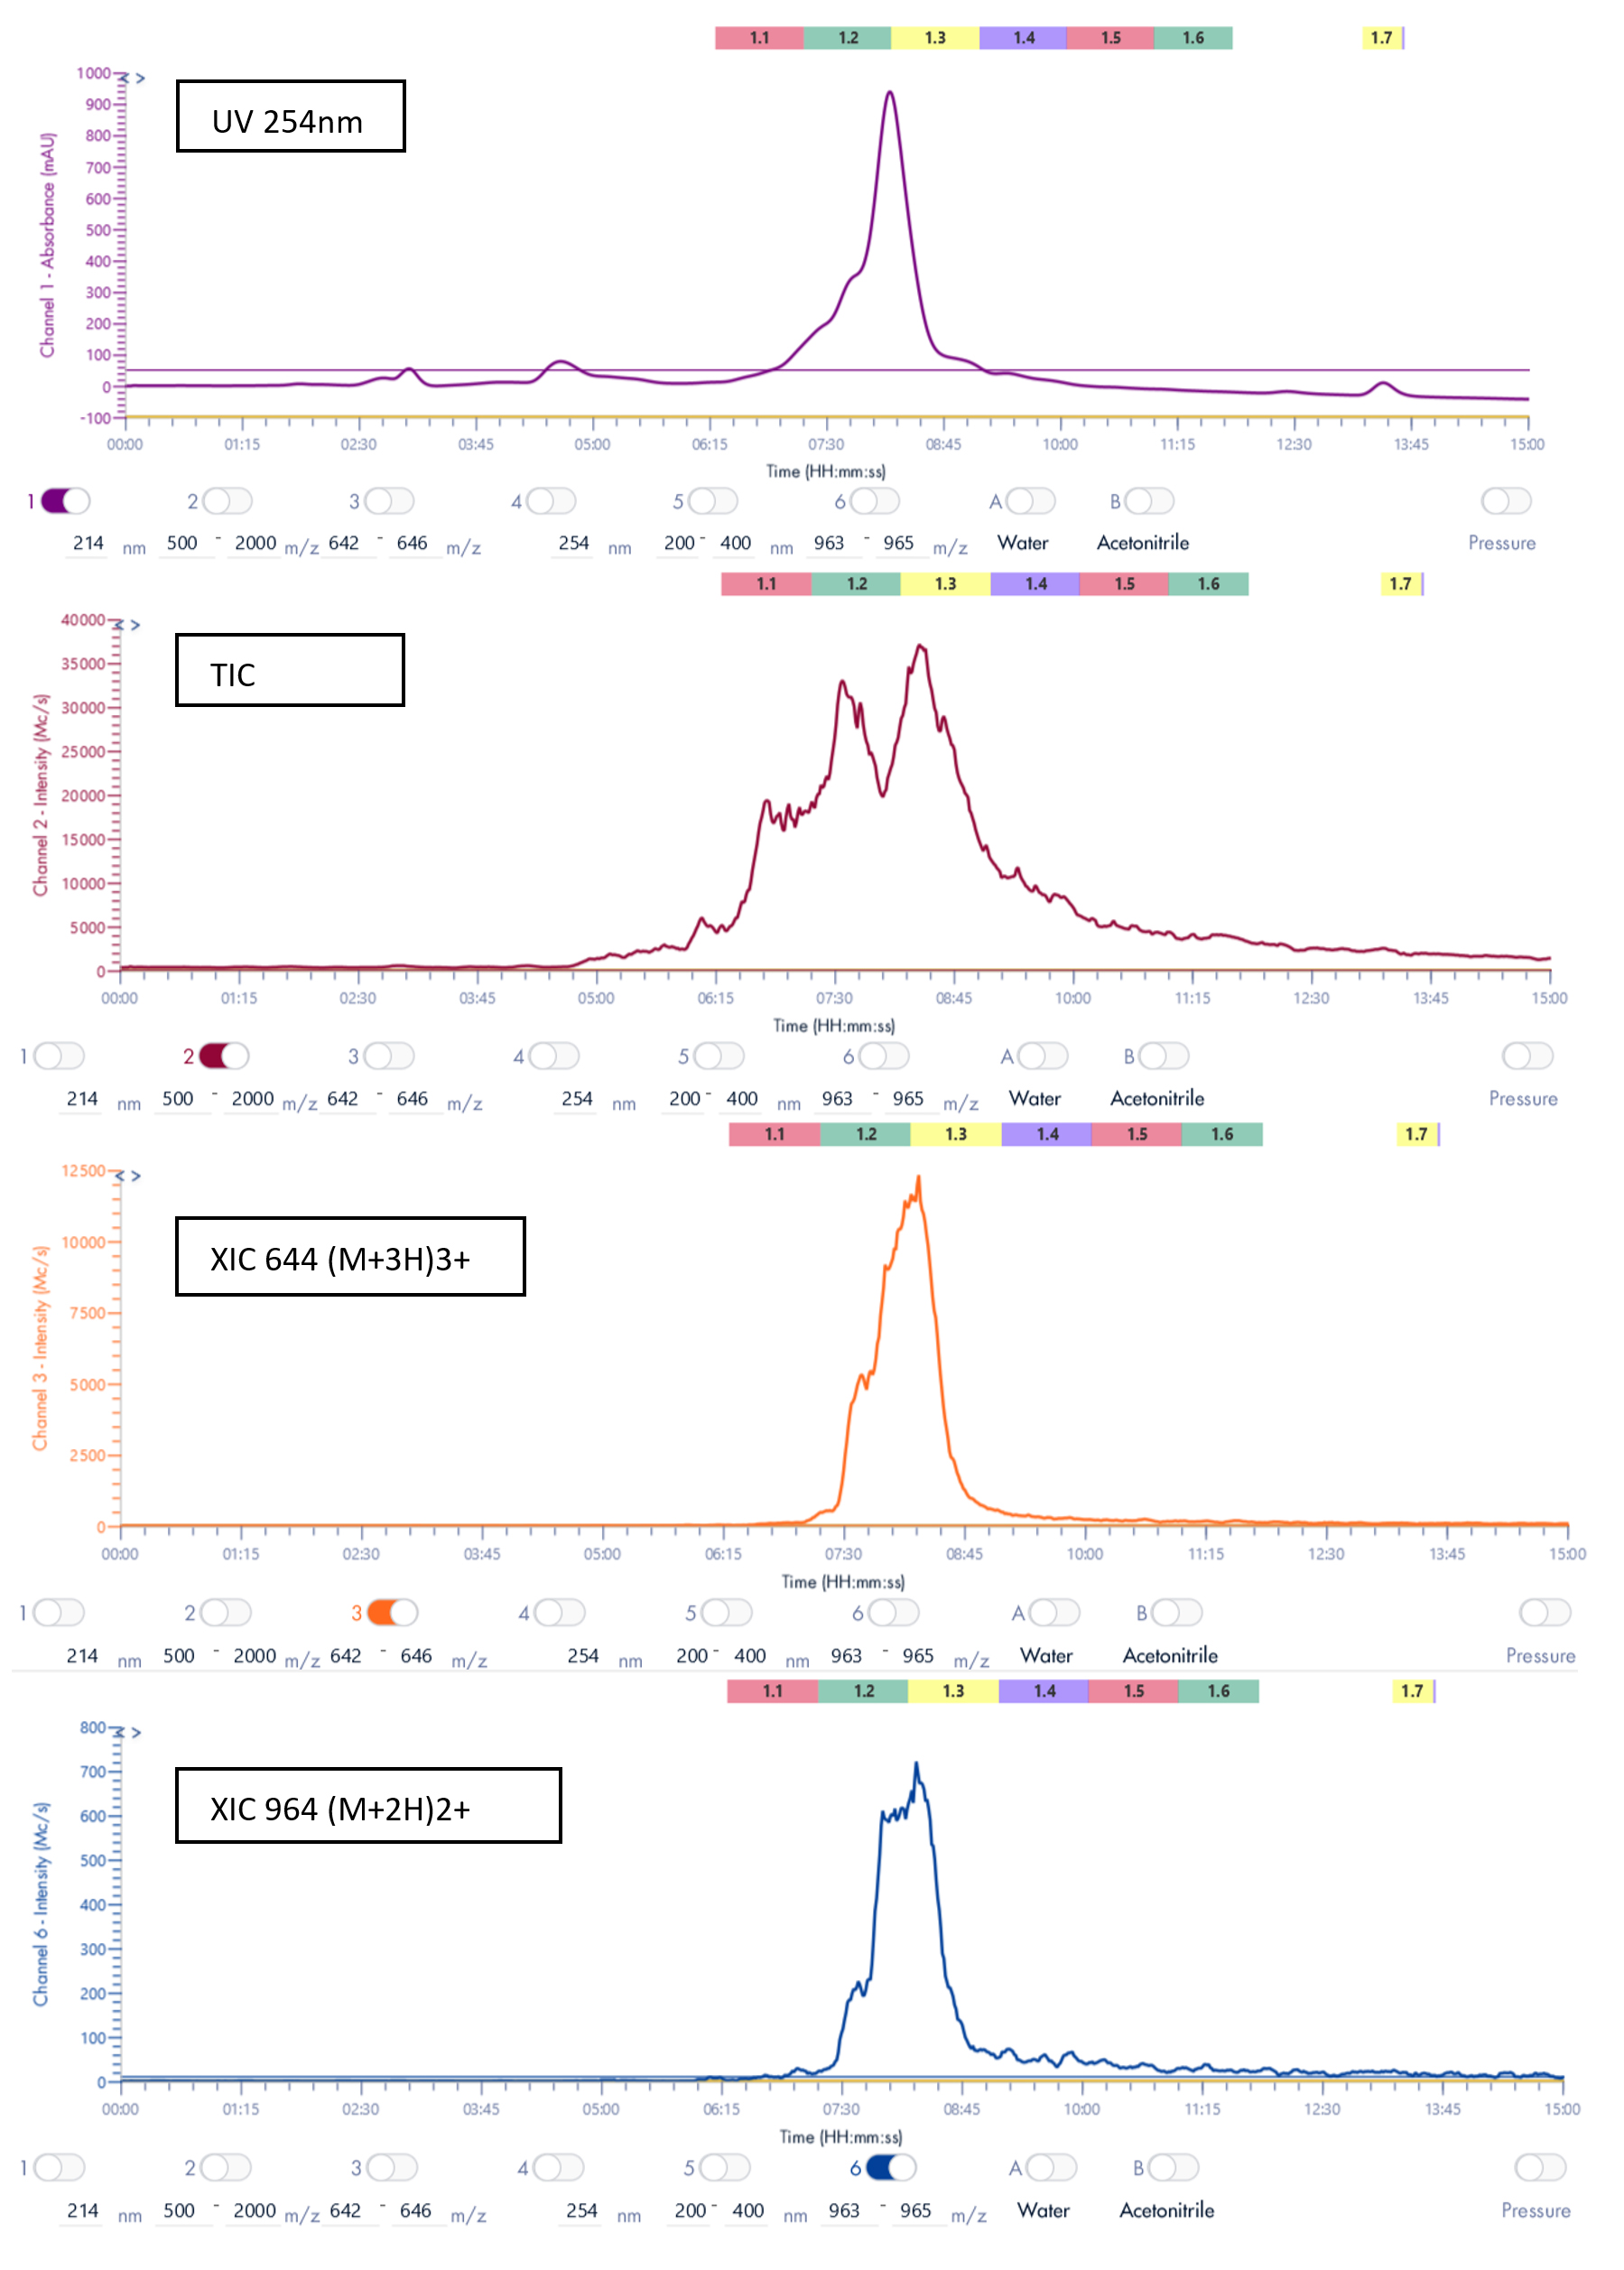
Thanks to the puriFlash 5.250P system coupled with the expression CMS, the product of interest was purified and collected based on its mass.

Better Chemistry from Intelligent Flash Purification

<< Click here to check out our latest whitepaper:
Breaking Through Bottlenecks in Organic Synthesis with a Streamlined Purification Workflow >>

We have all been there: You want to do a simple Flash purification.

Easy, right?

You then begin to prepare your reaction mixture, think about monitoring the reaction, confirming the product, developing the Flash method…

This post highlights some ways to make Flash purification easier than ever before. Read on for tips on reaction monitoring, purification and fraction ID.

<<click infographic to zoom>>

Pre-Flash Run: Performing (and monitoring) your reaction
Starting off you are faced with several decisions to make – decisions that can turn the simple purification process in to a half-day adventure in sample preparation and scrolling through social media while you wait for your LC/MS results.

The first decision you need to make is how you can quickly and easily make your compound and get that compound over to the Flash system. Pronto!

Tip #1: Reduce wait times.
If you think, “LC/MS is best!” you may want to reconsider. Reaction monitoring can be done much faster and easier using alternative technologies like TLC. Consider what you truly need – a quick answer to, ‘Did I make my compound?” Seek to find that answer in the easiest way possible, using the most straightforward (even basic) technology that you have on hand in your lab.

Tip #2: Reduce your sample preparation.
If you choose to use the TLC route over LC/MS (Bravo!) to monitor the reaction, you’ll still have a few steps between you and the Flash run. Namely, the annoyance of scraping spots, preparing them in a solvent for direct injection in to the mass spectrometer. It may be an opportunity to explore additional technologies available on the market, such as a TLC Plate Reader. This newer technology gives you push-button analysis of TLC plates. No scraping. No sample prep. No cleanup. Just results in seconds.

Imagine – your reaction complete and your compound of interest identified with only the push of a button!

<<click here for more information on reaction monitoring from Advion>>


During the Flash Run: Use the Tools at Hand
The nice thing is that (generally) technology is on our side. Thanks to AI and auto-runs and the ‘set-it-and-forget-it’ mentality of several tedious chemistry processes, we have luckily evolved to a time where many industry-leading experts have done the work for you.

Tip #3: Simplify Flash method development.
Several questions come up during method development in Flash that, unless you are an expert, you may not know definitively. What are your Rf values? Which column should you choose? If your Flash system offers the ability to simplify method development with suggested details, it is a good starting point and can help your routine purification run smoothly.

<<click here for more information on intelligent flash purification from Advion x interchim>>


After the Flash Run: Identifying Fractions

You’ve made it though your purification and feel confident about the work you put in so far. Hopefully you spent no time at all monitoring your reaction and preparing your method, and you feel confident that you let the Flash system help with method development. But what now? Is it finally time to dust off the old LC/MS?

Tip #4: Simplify Fraction ID
There is not one way to ID a compound. As we learned before, TLC is an ideal alternative to LC/MS for reaction monitoring. Now, we look at it from a different angle – how to quickly ID the fractions in your tubes without wasting any of your precious time?

Tools like the Advion ASAP liquids and solids probe are ideal fo this. The simple probe is dipped in to one of the tubes and then inserted in to the APCI ion source of the mass spec. This allows for prep-free sampling – and another way to skip the LC/MS.

<<click here for more information about the ASAP probe from Advion>>

Have any tips (or headaches) to add to this list? Email us, info@advion.com and make yourself known! We are happy to connect you with a Flash expert on our team.

Interested in a streamlined TLC to Flash to ASAP workflow system? Advion x Interchim is currently offering a free Flash system with the purchase of a mass spectrometer. Click here to learn more about the latest special offers.

Video more your style? Watch a full Flash workflow, from reaction to fraction in our latest clip: